Cypriot vs Immigrants from Bulgaria In Labor Force | Age 25-29
COMPARE
Cypriot
Immigrants from Bulgaria
In Labor Force | Age 25-29
In Labor Force | Age 25-29 Comparison
Cypriots
Immigrants from Bulgaria
85.8%
IN LABOR FORCE | AGE 25-29
99.9/ 100
METRIC RATING
35th/ 347
METRIC RANK
85.8%
IN LABOR FORCE | AGE 25-29
100.0/ 100
METRIC RATING
33rd/ 347
METRIC RANK
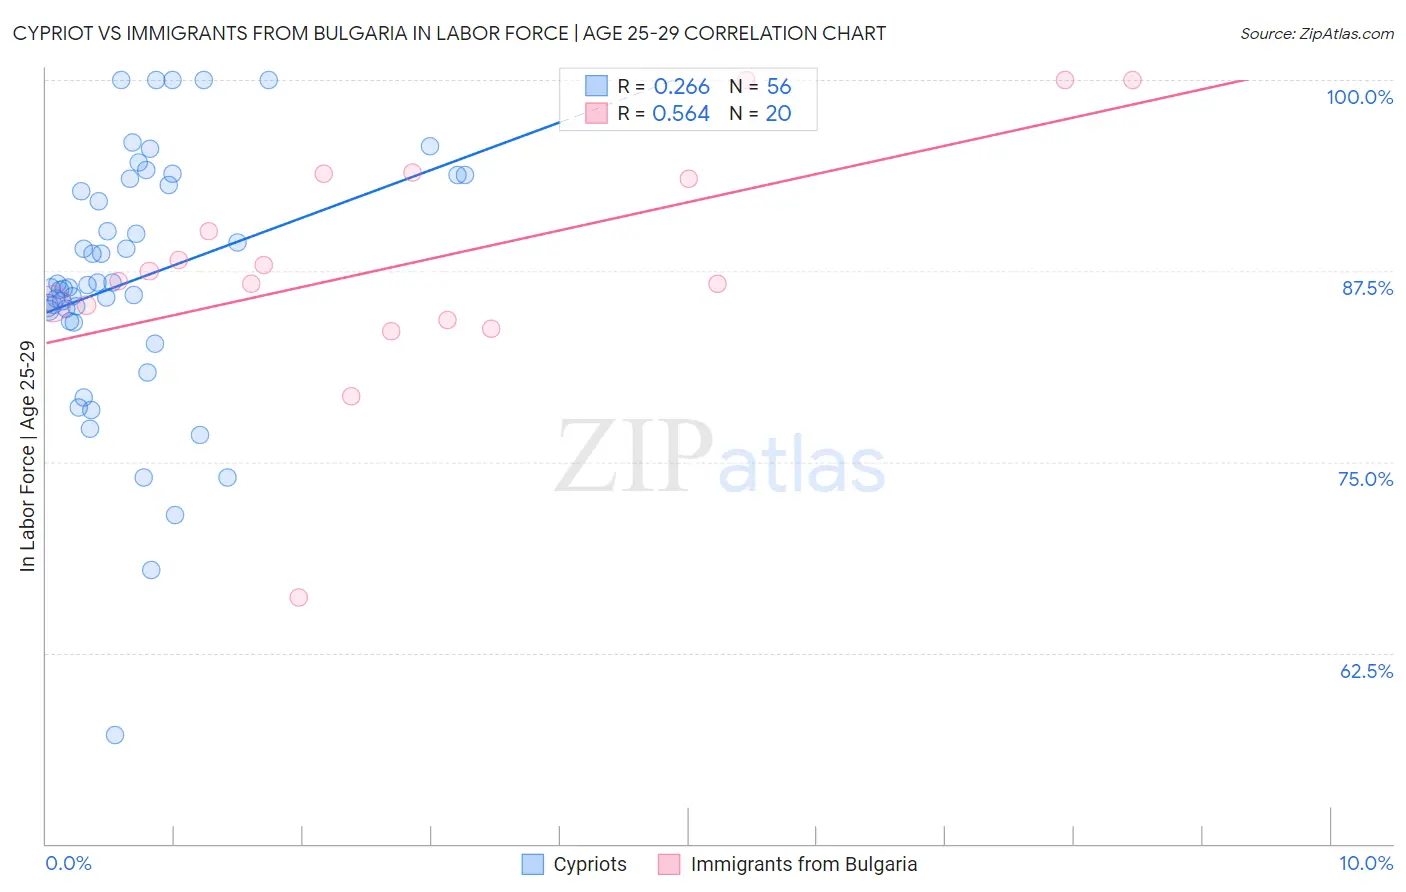
Cypriot vs Immigrants from Bulgaria In Labor Force | Age 25-29 Correlation Chart
The statistical analysis conducted on geographies consisting of 61,853,224 people shows a weak positive correlation between the proportion of Cypriots and labor force participation rate among population between the ages 25 and 29 in the United States with a correlation coefficient (R) of 0.266 and weighted average of 85.8%. Similarly, the statistical analysis conducted on geographies consisting of 172,543,550 people shows a substantial positive correlation between the proportion of Immigrants from Bulgaria and labor force participation rate among population between the ages 25 and 29 in the United States with a correlation coefficient (R) of 0.564 and weighted average of 85.8%, a difference of 0.040%.
In Labor Force | Age 25-29 Correlation Summary
| Measurement | Cypriot | Immigrants from Bulgaria |
| Minimum | 57.1% | 66.1% |
| Maximum | 100.0% | 100.0% |
| Range | 42.9% | 33.9% |
| Mean | 86.9% | 88.1% |
| Median | 86.5% | 87.2% |
| Interquartile 25% (IQ1) | 84.6% | 84.8% |
| Interquartile 75% (IQ3) | 93.3% | 93.7% |
| Interquartile Range (IQR) | 8.7% | 8.9% |
| Standard Deviation (Sample) | 8.4% | 7.8% |
| Standard Deviation (Population) | 8.3% | 7.6% |
Demographics Similar to Cypriots and Immigrants from Bulgaria by In Labor Force | Age 25-29
In terms of in labor force | age 25-29, the demographic groups most similar to Cypriots are Immigrants from Nepal (85.8%, a difference of 0.0%), Lithuanian (85.8%, a difference of 0.010%), Polish (85.8%, a difference of 0.030%), German Russian (85.8%, a difference of 0.040%), and Slovak (85.8%, a difference of 0.040%). Similarly, the demographic groups most similar to Immigrants from Bulgaria are German Russian (85.8%, a difference of 0.0%), Slovak (85.8%, a difference of 0.0%), Immigrants from Serbia (85.9%, a difference of 0.020%), Lithuanian (85.8%, a difference of 0.030%), and Immigrants from Nepal (85.8%, a difference of 0.040%).
| Demographics | Rating | Rank | In Labor Force | Age 25-29 |
| Immigrants | Eastern Africa | 100.0 /100 | #24 | Exceptional 86.0% |
| Sudanese | 100.0 /100 | #25 | Exceptional 85.9% |
| Immigrants | North Macedonia | 100.0 /100 | #26 | Exceptional 85.9% |
| Paraguayans | 100.0 /100 | #27 | Exceptional 85.9% |
| Ugandans | 100.0 /100 | #28 | Exceptional 85.9% |
| Immigrants | Liberia | 100.0 /100 | #29 | Exceptional 85.9% |
| Immigrants | Serbia | 100.0 /100 | #30 | Exceptional 85.9% |
| German Russians | 100.0 /100 | #31 | Exceptional 85.8% |
| Slovaks | 100.0 /100 | #32 | Exceptional 85.8% |
| Immigrants | Bulgaria | 100.0 /100 | #33 | Exceptional 85.8% |
| Lithuanians | 99.9 /100 | #34 | Exceptional 85.8% |
| Cypriots | 99.9 /100 | #35 | Exceptional 85.8% |
| Immigrants | Nepal | 99.9 /100 | #36 | Exceptional 85.8% |
| Poles | 99.9 /100 | #37 | Exceptional 85.8% |
| Sierra Leoneans | 99.9 /100 | #38 | Exceptional 85.8% |
| Croatians | 99.9 /100 | #39 | Exceptional 85.8% |
| Immigrants | Albania | 99.9 /100 | #40 | Exceptional 85.7% |
| Immigrants | Greece | 99.9 /100 | #41 | Exceptional 85.7% |
| Immigrants | Eritrea | 99.9 /100 | #42 | Exceptional 85.7% |
| Immigrants | India | 99.9 /100 | #43 | Exceptional 85.7% |
| Macedonians | 99.9 /100 | #44 | Exceptional 85.7% |