Immigrants from the Azores vs Immigrants from Bulgaria In Labor Force | Age 25-29
COMPARE
Immigrants from the Azores
Immigrants from Bulgaria
In Labor Force | Age 25-29
In Labor Force | Age 25-29 Comparison
Immigrants from the Azores
Immigrants from Bulgaria
83.1%
IN LABOR FORCE | AGE 25-29
0.0/ 100
METRIC RATING
283rd/ 347
METRIC RANK
85.8%
IN LABOR FORCE | AGE 25-29
100.0/ 100
METRIC RATING
33rd/ 347
METRIC RANK
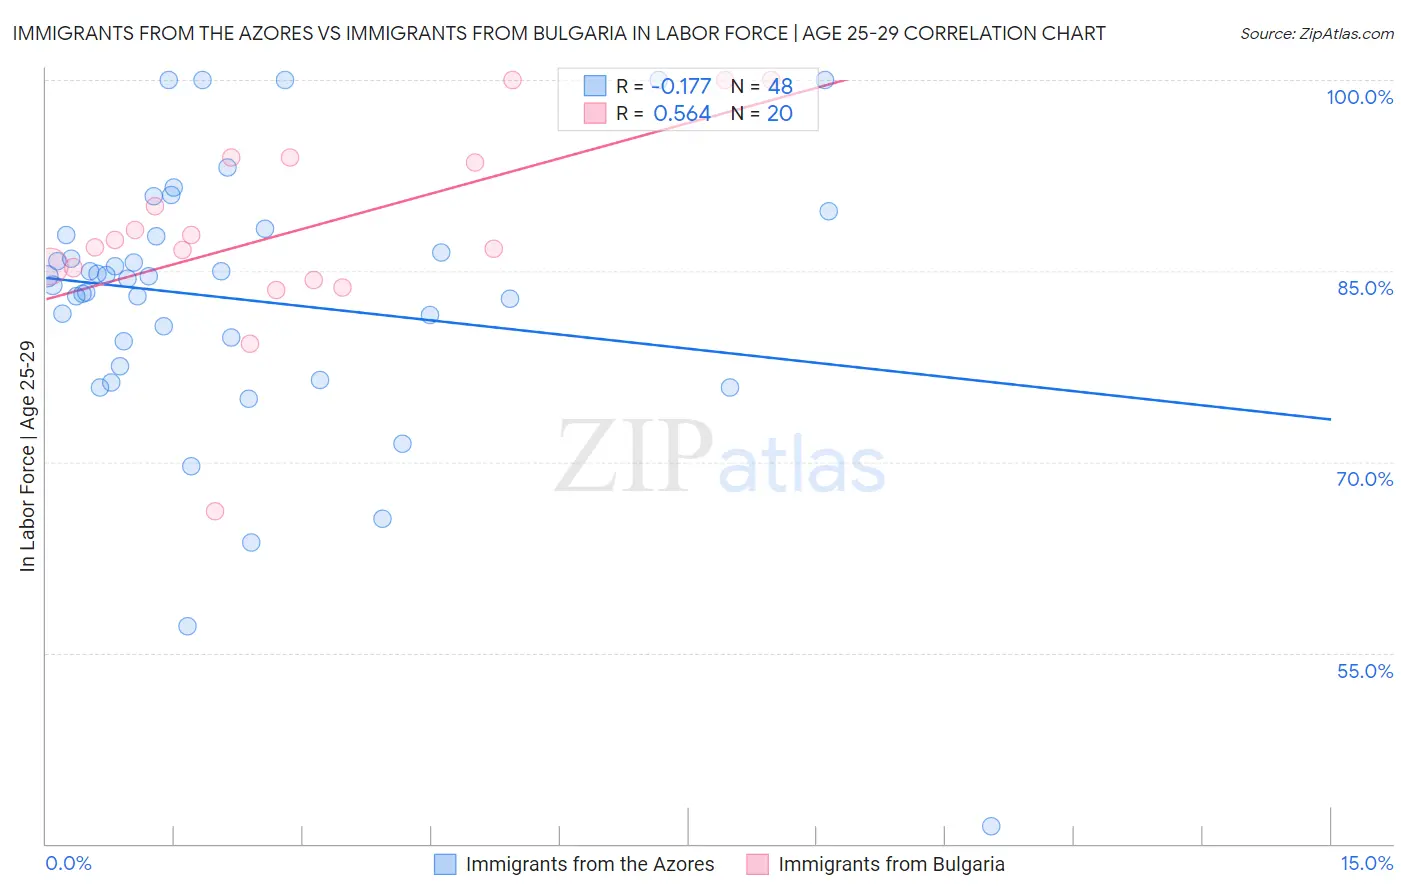
Immigrants from the Azores vs Immigrants from Bulgaria In Labor Force | Age 25-29 Correlation Chart
The statistical analysis conducted on geographies consisting of 46,246,668 people shows a poor negative correlation between the proportion of Immigrants from the Azores and labor force participation rate among population between the ages 25 and 29 in the United States with a correlation coefficient (R) of -0.177 and weighted average of 83.1%. Similarly, the statistical analysis conducted on geographies consisting of 172,543,550 people shows a substantial positive correlation between the proportion of Immigrants from Bulgaria and labor force participation rate among population between the ages 25 and 29 in the United States with a correlation coefficient (R) of 0.564 and weighted average of 85.8%, a difference of 3.3%.
In Labor Force | Age 25-29 Correlation Summary
| Measurement | Immigrants from the Azores | Immigrants from Bulgaria |
| Minimum | 41.4% | 66.1% |
| Maximum | 100.0% | 100.0% |
| Range | 58.6% | 33.9% |
| Mean | 82.7% | 88.1% |
| Median | 84.5% | 87.2% |
| Interquartile 25% (IQ1) | 78.5% | 84.8% |
| Interquartile 75% (IQ3) | 87.8% | 93.7% |
| Interquartile Range (IQR) | 9.3% | 8.9% |
| Standard Deviation (Sample) | 10.9% | 7.8% |
| Standard Deviation (Population) | 10.8% | 7.6% |
Similar Demographics by In Labor Force | Age 25-29
Demographics Similar to Immigrants from the Azores by In Labor Force | Age 25-29
In terms of in labor force | age 25-29, the demographic groups most similar to Immigrants from the Azores are American (83.1%, a difference of 0.0%), Immigrants from Dominican Republic (83.1%, a difference of 0.010%), Nicaraguan (83.1%, a difference of 0.020%), Belizean (83.1%, a difference of 0.060%), and Dominican (83.2%, a difference of 0.070%).
| Demographics | Rating | Rank | In Labor Force | Age 25-29 |
| Immigrants | Honduras | 0.0 /100 | #276 | Tragic 83.3% |
| Africans | 0.0 /100 | #277 | Tragic 83.2% |
| Immigrants | Cuba | 0.0 /100 | #278 | Tragic 83.2% |
| British West Indians | 0.0 /100 | #279 | Tragic 83.2% |
| Dominicans | 0.0 /100 | #280 | Tragic 83.2% |
| Immigrants | Dominican Republic | 0.0 /100 | #281 | Tragic 83.1% |
| Americans | 0.0 /100 | #282 | Tragic 83.1% |
| Immigrants | Azores | 0.0 /100 | #283 | Tragic 83.1% |
| Nicaraguans | 0.0 /100 | #284 | Tragic 83.1% |
| Belizeans | 0.0 /100 | #285 | Tragic 83.1% |
| Mexican American Indians | 0.0 /100 | #286 | Tragic 83.0% |
| Guyanese | 0.0 /100 | #287 | Tragic 83.0% |
| Ottawa | 0.0 /100 | #288 | Tragic 83.0% |
| Immigrants | Micronesia | 0.0 /100 | #289 | Tragic 83.0% |
| Immigrants | Bangladesh | 0.0 /100 | #290 | Tragic 83.0% |
Demographics Similar to Immigrants from Bulgaria by In Labor Force | Age 25-29
In terms of in labor force | age 25-29, the demographic groups most similar to Immigrants from Bulgaria are German Russian (85.8%, a difference of 0.0%), Slovak (85.8%, a difference of 0.0%), Immigrants from Serbia (85.9%, a difference of 0.020%), Lithuanian (85.8%, a difference of 0.030%), and Cypriot (85.8%, a difference of 0.040%).
| Demographics | Rating | Rank | In Labor Force | Age 25-29 |
| Immigrants | North Macedonia | 100.0 /100 | #26 | Exceptional 85.9% |
| Paraguayans | 100.0 /100 | #27 | Exceptional 85.9% |
| Ugandans | 100.0 /100 | #28 | Exceptional 85.9% |
| Immigrants | Liberia | 100.0 /100 | #29 | Exceptional 85.9% |
| Immigrants | Serbia | 100.0 /100 | #30 | Exceptional 85.9% |
| German Russians | 100.0 /100 | #31 | Exceptional 85.8% |
| Slovaks | 100.0 /100 | #32 | Exceptional 85.8% |
| Immigrants | Bulgaria | 100.0 /100 | #33 | Exceptional 85.8% |
| Lithuanians | 99.9 /100 | #34 | Exceptional 85.8% |
| Cypriots | 99.9 /100 | #35 | Exceptional 85.8% |
| Immigrants | Nepal | 99.9 /100 | #36 | Exceptional 85.8% |
| Poles | 99.9 /100 | #37 | Exceptional 85.8% |
| Sierra Leoneans | 99.9 /100 | #38 | Exceptional 85.8% |
| Croatians | 99.9 /100 | #39 | Exceptional 85.8% |
| Immigrants | Albania | 99.9 /100 | #40 | Exceptional 85.7% |