Lebanese vs Iranian In Labor Force | Age 25-29
COMPARE
Lebanese
Iranian
In Labor Force | Age 25-29
In Labor Force | Age 25-29 Comparison
Lebanese
Iranians
84.3%
IN LABOR FORCE | AGE 25-29
11.1/ 100
METRIC RATING
214th/ 347
METRIC RANK
84.8%
IN LABOR FORCE | AGE 25-29
78.1/ 100
METRIC RATING
131st/ 347
METRIC RANK
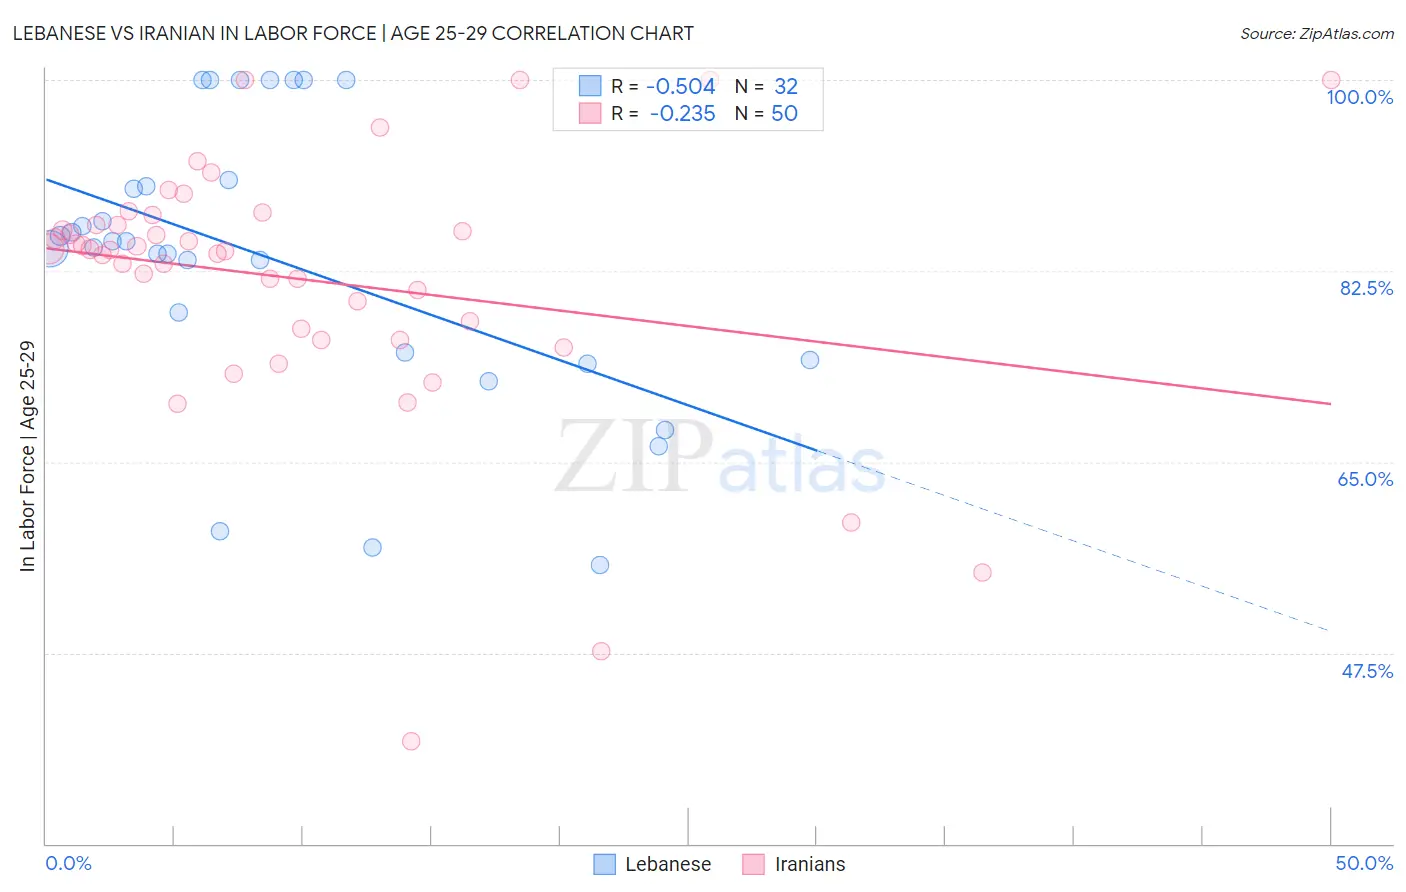
Lebanese vs Iranian In Labor Force | Age 25-29 Correlation Chart
The statistical analysis conducted on geographies consisting of 401,455,455 people shows a substantial negative correlation between the proportion of Lebanese and labor force participation rate among population between the ages 25 and 29 in the United States with a correlation coefficient (R) of -0.504 and weighted average of 84.3%. Similarly, the statistical analysis conducted on geographies consisting of 316,808,668 people shows a weak negative correlation between the proportion of Iranians and labor force participation rate among population between the ages 25 and 29 in the United States with a correlation coefficient (R) of -0.235 and weighted average of 84.8%, a difference of 0.62%.
In Labor Force | Age 25-29 Correlation Summary
| Measurement | Lebanese | Iranian |
| Minimum | 55.6% | 39.4% |
| Maximum | 100.0% | 100.0% |
| Range | 44.4% | 60.6% |
| Mean | 83.5% | 81.8% |
| Median | 84.9% | 84.5% |
| Interquartile 25% (IQ1) | 74.7% | 77.2% |
| Interquartile 75% (IQ3) | 90.5% | 86.7% |
| Interquartile Range (IQR) | 15.9% | 9.6% |
| Standard Deviation (Sample) | 12.8% | 11.9% |
| Standard Deviation (Population) | 12.6% | 11.8% |
Similar Demographics by In Labor Force | Age 25-29
Demographics Similar to Lebanese by In Labor Force | Age 25-29
In terms of in labor force | age 25-29, the demographic groups most similar to Lebanese are Subsaharan African (84.3%, a difference of 0.010%), Japanese (84.3%, a difference of 0.010%), Immigrants from Syria (84.3%, a difference of 0.010%), Immigrants from Jordan (84.4%, a difference of 0.030%), and Chinese (84.3%, a difference of 0.030%).
| Demographics | Rating | Rank | In Labor Force | Age 25-29 |
| Immigrants | Armenia | 13.3 /100 | #207 | Poor 84.4% |
| Immigrants | Indonesia | 13.2 /100 | #208 | Poor 84.4% |
| Immigrants | Jordan | 12.8 /100 | #209 | Poor 84.4% |
| Chinese | 12.7 /100 | #210 | Poor 84.3% |
| Immigrants | Venezuela | 12.6 /100 | #211 | Poor 84.3% |
| Sub-Saharan Africans | 11.7 /100 | #212 | Poor 84.3% |
| Japanese | 11.4 /100 | #213 | Poor 84.3% |
| Lebanese | 11.1 /100 | #214 | Poor 84.3% |
| Immigrants | Syria | 10.7 /100 | #215 | Poor 84.3% |
| Israelis | 9.3 /100 | #216 | Tragic 84.3% |
| Immigrants | Ecuador | 9.3 /100 | #217 | Tragic 84.3% |
| Immigrants | Nigeria | 9.0 /100 | #218 | Tragic 84.3% |
| Immigrants | Saudi Arabia | 8.8 /100 | #219 | Tragic 84.3% |
| Nigerians | 7.2 /100 | #220 | Tragic 84.3% |
| Arabs | 6.8 /100 | #221 | Tragic 84.2% |
Demographics Similar to Iranians by In Labor Force | Age 25-29
In terms of in labor force | age 25-29, the demographic groups most similar to Iranians are Romanian (84.8%, a difference of 0.0%), Asian (84.8%, a difference of 0.0%), Syrian (84.8%, a difference of 0.020%), Immigrants from Hungary (84.8%, a difference of 0.020%), and Bhutanese (84.8%, a difference of 0.020%).
| Demographics | Rating | Rank | In Labor Force | Age 25-29 |
| Immigrants | Iran | 84.8 /100 | #124 | Excellent 84.9% |
| Uruguayans | 84.7 /100 | #125 | Excellent 84.9% |
| Immigrants | Singapore | 84.4 /100 | #126 | Excellent 84.9% |
| Immigrants | Uruguay | 84.0 /100 | #127 | Excellent 84.9% |
| Australians | 83.6 /100 | #128 | Excellent 84.9% |
| Immigrants | Russia | 81.6 /100 | #129 | Excellent 84.9% |
| Northern Europeans | 81.3 /100 | #130 | Excellent 84.9% |
| Iranians | 78.1 /100 | #131 | Good 84.8% |
| Romanians | 77.7 /100 | #132 | Good 84.8% |
| Asians | 77.7 /100 | #133 | Good 84.8% |
| Syrians | 76.5 /100 | #134 | Good 84.8% |
| Immigrants | Hungary | 76.4 /100 | #135 | Good 84.8% |
| Bhutanese | 76.0 /100 | #136 | Good 84.8% |
| Immigrants | Canada | 73.5 /100 | #137 | Good 84.8% |
| Armenians | 72.7 /100 | #138 | Good 84.8% |