Bermudan vs Immigrants from Bulgaria In Labor Force | Age 25-29
COMPARE
Bermudan
Immigrants from Bulgaria
In Labor Force | Age 25-29
In Labor Force | Age 25-29 Comparison
Bermudans
Immigrants from Bulgaria
86.0%
IN LABOR FORCE | AGE 25-29
100.0/ 100
METRIC RATING
17th/ 347
METRIC RANK
85.8%
IN LABOR FORCE | AGE 25-29
100.0/ 100
METRIC RATING
33rd/ 347
METRIC RANK
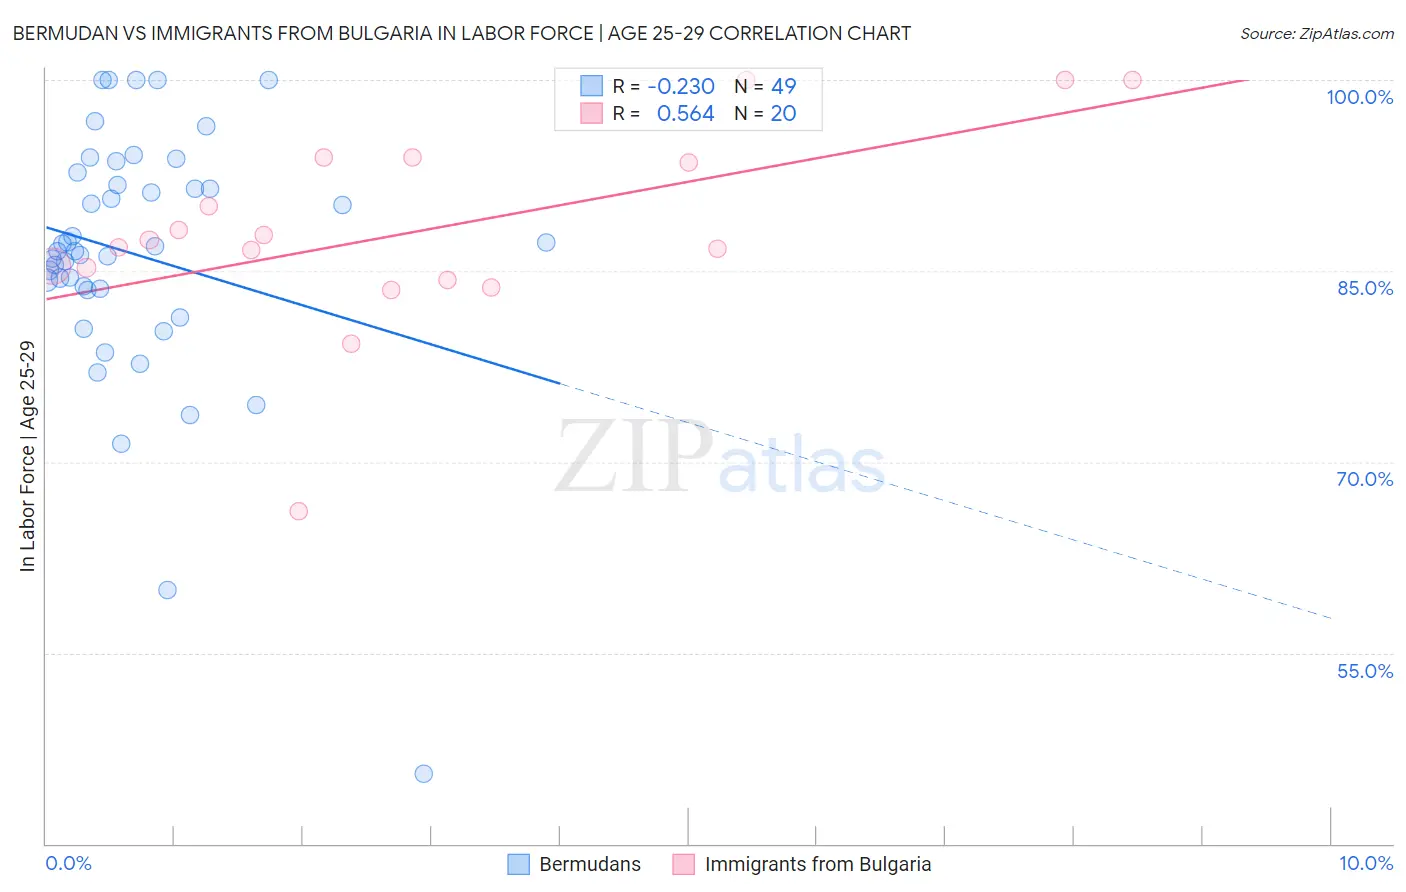
Bermudan vs Immigrants from Bulgaria In Labor Force | Age 25-29 Correlation Chart
The statistical analysis conducted on geographies consisting of 55,723,505 people shows a weak negative correlation between the proportion of Bermudans and labor force participation rate among population between the ages 25 and 29 in the United States with a correlation coefficient (R) of -0.230 and weighted average of 86.0%. Similarly, the statistical analysis conducted on geographies consisting of 172,543,550 people shows a substantial positive correlation between the proportion of Immigrants from Bulgaria and labor force participation rate among population between the ages 25 and 29 in the United States with a correlation coefficient (R) of 0.564 and weighted average of 85.8%, a difference of 0.24%.
In Labor Force | Age 25-29 Correlation Summary
| Measurement | Bermudan | Immigrants from Bulgaria |
| Minimum | 45.5% | 66.1% |
| Maximum | 100.0% | 100.0% |
| Range | 54.5% | 33.9% |
| Mean | 86.3% | 88.1% |
| Median | 86.6% | 87.2% |
| Interquartile 25% (IQ1) | 83.5% | 84.8% |
| Interquartile 75% (IQ3) | 92.2% | 93.7% |
| Interquartile Range (IQR) | 8.7% | 8.9% |
| Standard Deviation (Sample) | 10.0% | 7.8% |
| Standard Deviation (Population) | 9.9% | 7.6% |
Demographics Similar to Bermudans and Immigrants from Bulgaria by In Labor Force | Age 25-29
In terms of in labor force | age 25-29, the demographic groups most similar to Bermudans are Bulgarian (86.0%, a difference of 0.030%), Immigrants from Bolivia (86.1%, a difference of 0.040%), Cape Verdean (86.0%, a difference of 0.040%), Bolivian (86.1%, a difference of 0.050%), and Immigrants from Ireland (86.0%, a difference of 0.050%). Similarly, the demographic groups most similar to Immigrants from Bulgaria are German Russian (85.8%, a difference of 0.0%), Slovak (85.8%, a difference of 0.0%), Immigrants from Serbia (85.9%, a difference of 0.020%), Lithuanian (85.8%, a difference of 0.030%), and Cypriot (85.8%, a difference of 0.040%).
| Demographics | Rating | Rank | In Labor Force | Age 25-29 |
| Bolivians | 100.0 /100 | #15 | Exceptional 86.1% |
| Immigrants | Bolivia | 100.0 /100 | #16 | Exceptional 86.1% |
| Bermudans | 100.0 /100 | #17 | Exceptional 86.0% |
| Bulgarians | 100.0 /100 | #18 | Exceptional 86.0% |
| Cape Verdeans | 100.0 /100 | #19 | Exceptional 86.0% |
| Immigrants | Ireland | 100.0 /100 | #20 | Exceptional 86.0% |
| Maltese | 100.0 /100 | #21 | Exceptional 86.0% |
| Cambodians | 100.0 /100 | #22 | Exceptional 86.0% |
| Immigrants | Uganda | 100.0 /100 | #23 | Exceptional 86.0% |
| Immigrants | Eastern Africa | 100.0 /100 | #24 | Exceptional 86.0% |
| Sudanese | 100.0 /100 | #25 | Exceptional 85.9% |
| Immigrants | North Macedonia | 100.0 /100 | #26 | Exceptional 85.9% |
| Paraguayans | 100.0 /100 | #27 | Exceptional 85.9% |
| Ugandans | 100.0 /100 | #28 | Exceptional 85.9% |
| Immigrants | Liberia | 100.0 /100 | #29 | Exceptional 85.9% |
| Immigrants | Serbia | 100.0 /100 | #30 | Exceptional 85.9% |
| German Russians | 100.0 /100 | #31 | Exceptional 85.8% |
| Slovaks | 100.0 /100 | #32 | Exceptional 85.8% |
| Immigrants | Bulgaria | 100.0 /100 | #33 | Exceptional 85.8% |
| Lithuanians | 99.9 /100 | #34 | Exceptional 85.8% |
| Cypriots | 99.9 /100 | #35 | Exceptional 85.8% |