Lebanese vs Chickasaw In Labor Force | Age 30-34
COMPARE
Lebanese
Chickasaw
In Labor Force | Age 30-34
In Labor Force | Age 30-34 Comparison
Lebanese
Chickasaw
84.4%
IN LABOR FORCE | AGE 30-34
10.6/ 100
METRIC RATING
206th/ 347
METRIC RANK
81.9%
IN LABOR FORCE | AGE 30-34
0.0/ 100
METRIC RATING
311th/ 347
METRIC RANK
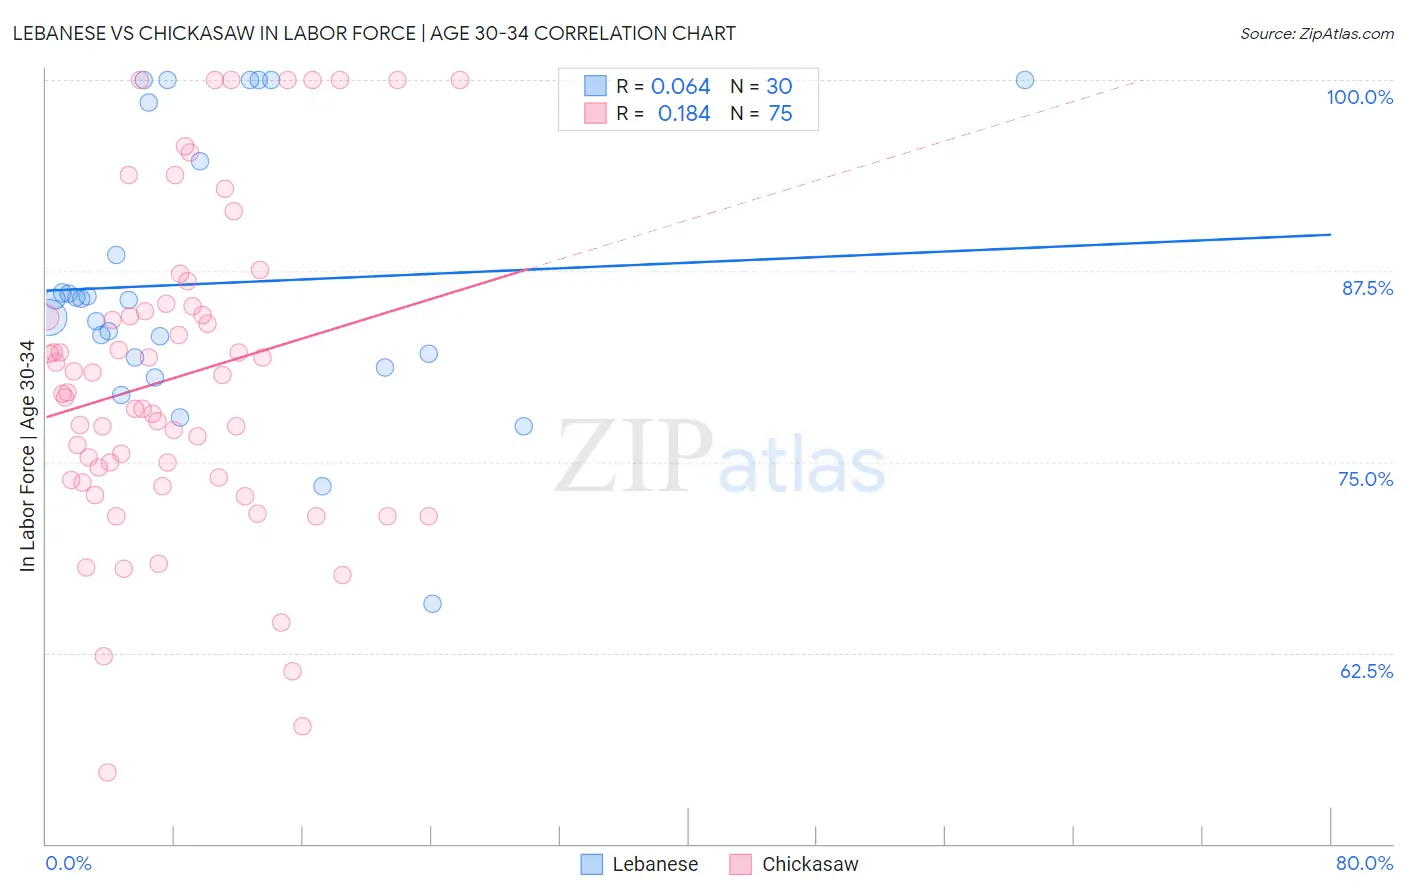
Lebanese vs Chickasaw In Labor Force | Age 30-34 Correlation Chart
The statistical analysis conducted on geographies consisting of 401,295,457 people shows a slight positive correlation between the proportion of Lebanese and labor force participation rate among population between the ages 30 and 34 in the United States with a correlation coefficient (R) of 0.064 and weighted average of 84.4%. Similarly, the statistical analysis conducted on geographies consisting of 147,694,826 people shows a poor positive correlation between the proportion of Chickasaw and labor force participation rate among population between the ages 30 and 34 in the United States with a correlation coefficient (R) of 0.184 and weighted average of 81.9%, a difference of 3.0%.
In Labor Force | Age 30-34 Correlation Summary
| Measurement | Lebanese | Chickasaw |
| Minimum | 65.7% | 54.6% |
| Maximum | 100.0% | 100.0% |
| Range | 34.3% | 45.4% |
| Mean | 86.7% | 80.6% |
| Median | 85.6% | 79.6% |
| Interquartile 25% (IQ1) | 81.8% | 73.8% |
| Interquartile 75% (IQ3) | 94.7% | 85.2% |
| Interquartile Range (IQR) | 12.9% | 11.4% |
| Standard Deviation (Sample) | 8.8% | 10.5% |
| Standard Deviation (Population) | 8.7% | 10.4% |
Similar Demographics by In Labor Force | Age 30-34
Demographics Similar to Lebanese by In Labor Force | Age 30-34
In terms of in labor force | age 30-34, the demographic groups most similar to Lebanese are Bangladeshi (84.3%, a difference of 0.020%), Arab (84.3%, a difference of 0.030%), Jamaican (84.3%, a difference of 0.040%), Indonesian (84.3%, a difference of 0.040%), and Japanese (84.3%, a difference of 0.040%).
| Demographics | Rating | Rank | In Labor Force | Age 30-34 |
| Immigrants | Thailand | 19.1 /100 | #199 | Poor 84.5% |
| Sub-Saharan Africans | 19.0 /100 | #200 | Poor 84.5% |
| Trinidadians and Tobagonians | 18.2 /100 | #201 | Poor 84.5% |
| Immigrants | West Indies | 18.1 /100 | #202 | Poor 84.5% |
| Canadians | 15.4 /100 | #203 | Poor 84.4% |
| Ecuadorians | 14.2 /100 | #204 | Poor 84.4% |
| French | 13.8 /100 | #205 | Poor 84.4% |
| Lebanese | 10.6 /100 | #206 | Poor 84.4% |
| Bangladeshis | 9.4 /100 | #207 | Tragic 84.3% |
| Arabs | 8.9 /100 | #208 | Tragic 84.3% |
| Jamaicans | 8.8 /100 | #209 | Tragic 84.3% |
| Indonesians | 8.8 /100 | #210 | Tragic 84.3% |
| Japanese | 8.8 /100 | #211 | Tragic 84.3% |
| Immigrants | Western Asia | 8.2 /100 | #212 | Tragic 84.3% |
| Immigrants | Jamaica | 7.9 /100 | #213 | Tragic 84.3% |
Demographics Similar to Chickasaw by In Labor Force | Age 30-34
In terms of in labor force | age 30-34, the demographic groups most similar to Chickasaw are Mexican (81.9%, a difference of 0.0%), Iroquois (81.9%, a difference of 0.020%), Cajun (82.0%, a difference of 0.050%), Immigrants from Mexico (82.0%, a difference of 0.070%), and Puget Sound Salish (82.1%, a difference of 0.24%).
| Demographics | Rating | Rank | In Labor Force | Age 30-34 |
| Tlingit-Haida | 0.0 /100 | #304 | Tragic 82.3% |
| Osage | 0.0 /100 | #305 | Tragic 82.3% |
| Spanish American Indians | 0.0 /100 | #306 | Tragic 82.2% |
| Menominee | 0.0 /100 | #307 | Tragic 82.2% |
| Puget Sound Salish | 0.0 /100 | #308 | Tragic 82.1% |
| Immigrants | Mexico | 0.0 /100 | #309 | Tragic 82.0% |
| Cajuns | 0.0 /100 | #310 | Tragic 82.0% |
| Chickasaw | 0.0 /100 | #311 | Tragic 81.9% |
| Mexicans | 0.0 /100 | #312 | Tragic 81.9% |
| Iroquois | 0.0 /100 | #313 | Tragic 81.9% |
| Alaskan Athabascans | 0.0 /100 | #314 | Tragic 81.7% |
| Cherokee | 0.0 /100 | #315 | Tragic 81.6% |
| Immigrants | Azores | 0.0 /100 | #316 | Tragic 81.5% |
| Arapaho | 0.0 /100 | #317 | Tragic 81.5% |
| Choctaw | 0.0 /100 | #318 | Tragic 81.4% |