Lebanese vs Spaniard In Labor Force | Age 30-34
COMPARE
Lebanese
Spaniard
In Labor Force | Age 30-34
In Labor Force | Age 30-34 Comparison
Lebanese
Spaniards
84.4%
IN LABOR FORCE | AGE 30-34
10.6/ 100
METRIC RATING
206th/ 347
METRIC RANK
83.6%
IN LABOR FORCE | AGE 30-34
0.1/ 100
METRIC RATING
267th/ 347
METRIC RANK
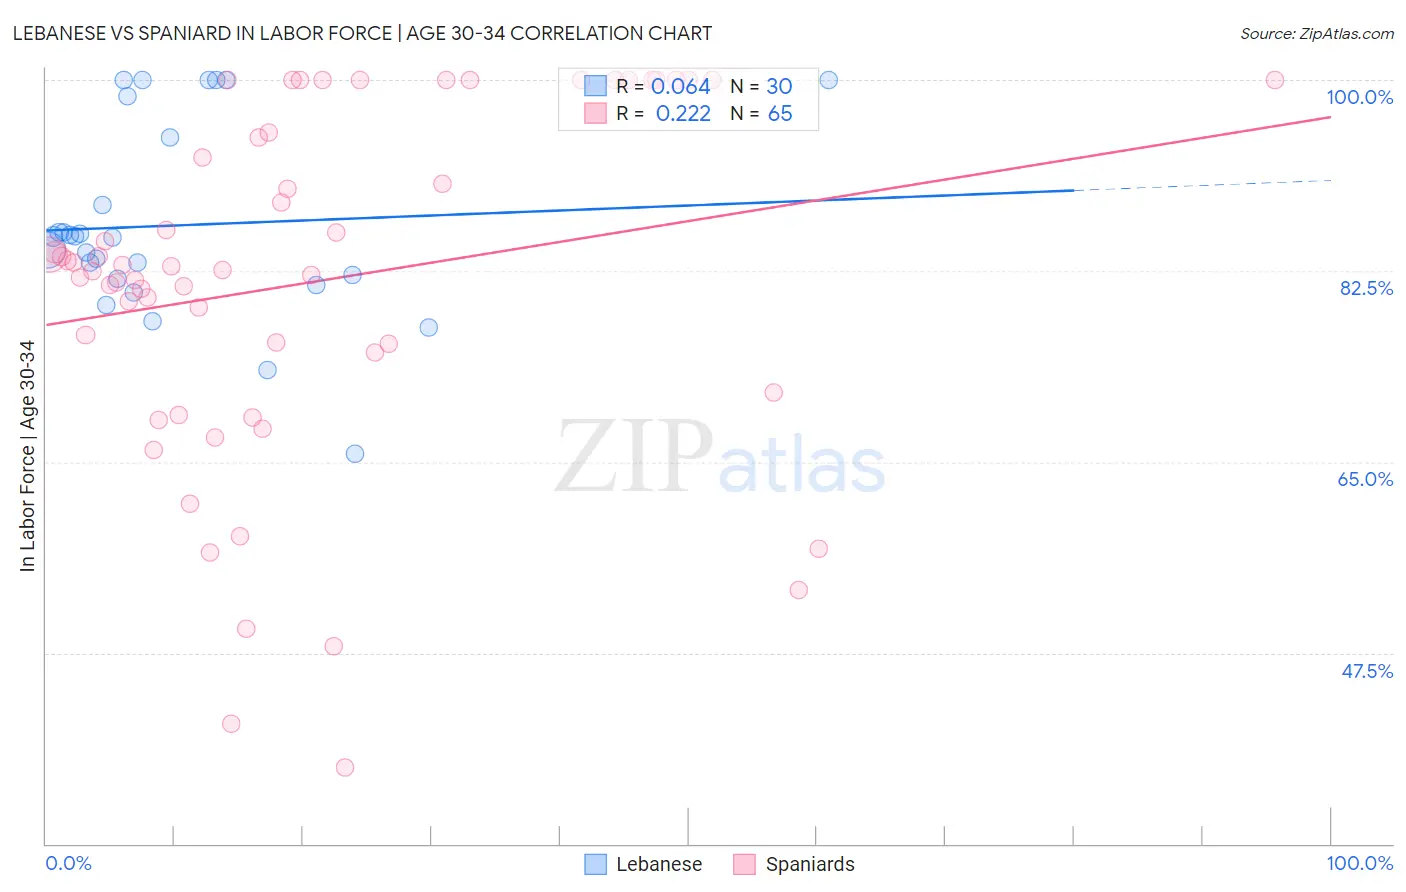
Lebanese vs Spaniard In Labor Force | Age 30-34 Correlation Chart
The statistical analysis conducted on geographies consisting of 401,295,457 people shows a slight positive correlation between the proportion of Lebanese and labor force participation rate among population between the ages 30 and 34 in the United States with a correlation coefficient (R) of 0.064 and weighted average of 84.4%. Similarly, the statistical analysis conducted on geographies consisting of 443,126,023 people shows a weak positive correlation between the proportion of Spaniards and labor force participation rate among population between the ages 30 and 34 in the United States with a correlation coefficient (R) of 0.222 and weighted average of 83.6%, a difference of 0.90%.
In Labor Force | Age 30-34 Correlation Summary
| Measurement | Lebanese | Spaniard |
| Minimum | 65.7% | 36.9% |
| Maximum | 100.0% | 100.0% |
| Range | 34.3% | 63.1% |
| Mean | 86.7% | 81.5% |
| Median | 85.6% | 82.9% |
| Interquartile 25% (IQ1) | 81.8% | 73.2% |
| Interquartile 75% (IQ3) | 94.7% | 97.6% |
| Interquartile Range (IQR) | 12.9% | 24.4% |
| Standard Deviation (Sample) | 8.8% | 16.0% |
| Standard Deviation (Population) | 8.7% | 15.8% |
Similar Demographics by In Labor Force | Age 30-34
Demographics Similar to Lebanese by In Labor Force | Age 30-34
In terms of in labor force | age 30-34, the demographic groups most similar to Lebanese are Bangladeshi (84.3%, a difference of 0.020%), Arab (84.3%, a difference of 0.030%), Jamaican (84.3%, a difference of 0.040%), Indonesian (84.3%, a difference of 0.040%), and Japanese (84.3%, a difference of 0.040%).
| Demographics | Rating | Rank | In Labor Force | Age 30-34 |
| Immigrants | Thailand | 19.1 /100 | #199 | Poor 84.5% |
| Sub-Saharan Africans | 19.0 /100 | #200 | Poor 84.5% |
| Trinidadians and Tobagonians | 18.2 /100 | #201 | Poor 84.5% |
| Immigrants | West Indies | 18.1 /100 | #202 | Poor 84.5% |
| Canadians | 15.4 /100 | #203 | Poor 84.4% |
| Ecuadorians | 14.2 /100 | #204 | Poor 84.4% |
| French | 13.8 /100 | #205 | Poor 84.4% |
| Lebanese | 10.6 /100 | #206 | Poor 84.4% |
| Bangladeshis | 9.4 /100 | #207 | Tragic 84.3% |
| Arabs | 8.9 /100 | #208 | Tragic 84.3% |
| Jamaicans | 8.8 /100 | #209 | Tragic 84.3% |
| Indonesians | 8.8 /100 | #210 | Tragic 84.3% |
| Japanese | 8.8 /100 | #211 | Tragic 84.3% |
| Immigrants | Western Asia | 8.2 /100 | #212 | Tragic 84.3% |
| Immigrants | Jamaica | 7.9 /100 | #213 | Tragic 84.3% |
Demographics Similar to Spaniards by In Labor Force | Age 30-34
In terms of in labor force | age 30-34, the demographic groups most similar to Spaniards are Immigrants from Bangladesh (83.6%, a difference of 0.010%), Vietnamese (83.6%, a difference of 0.020%), Spanish American (83.5%, a difference of 0.070%), Spanish (83.5%, a difference of 0.090%), and Nonimmigrants (83.5%, a difference of 0.090%).
| Demographics | Rating | Rank | In Labor Force | Age 30-34 |
| Immigrants | Dominican Republic | 0.3 /100 | #260 | Tragic 83.8% |
| Guyanese | 0.3 /100 | #261 | Tragic 83.8% |
| Dominicans | 0.2 /100 | #262 | Tragic 83.8% |
| Immigrants | Guyana | 0.2 /100 | #263 | Tragic 83.8% |
| Guatemalans | 0.2 /100 | #264 | Tragic 83.7% |
| Immigrants | Honduras | 0.1 /100 | #265 | Tragic 83.7% |
| Immigrants | Guatemala | 0.1 /100 | #266 | Tragic 83.7% |
| Spaniards | 0.1 /100 | #267 | Tragic 83.6% |
| Immigrants | Bangladesh | 0.1 /100 | #268 | Tragic 83.6% |
| Vietnamese | 0.1 /100 | #269 | Tragic 83.6% |
| Spanish Americans | 0.0 /100 | #270 | Tragic 83.5% |
| Spanish | 0.0 /100 | #271 | Tragic 83.5% |
| Immigrants | Nonimmigrants | 0.0 /100 | #272 | Tragic 83.5% |
| Guamanians/Chamorros | 0.0 /100 | #273 | Tragic 83.5% |
| Belizeans | 0.0 /100 | #274 | Tragic 83.5% |