Latvian vs Immigrants from Burma/Myanmar In Labor Force | Age 20-24
COMPARE
Latvian
Immigrants from Burma/Myanmar
In Labor Force | Age 20-24
In Labor Force | Age 20-24 Comparison
Latvians
Immigrants from Burma/Myanmar
76.1%
IN LABOR FORCE | AGE 20-24
97.6/ 100
METRIC RATING
102nd/ 347
METRIC RANK
76.3%
IN LABOR FORCE | AGE 20-24
99.1/ 100
METRIC RATING
90th/ 347
METRIC RANK
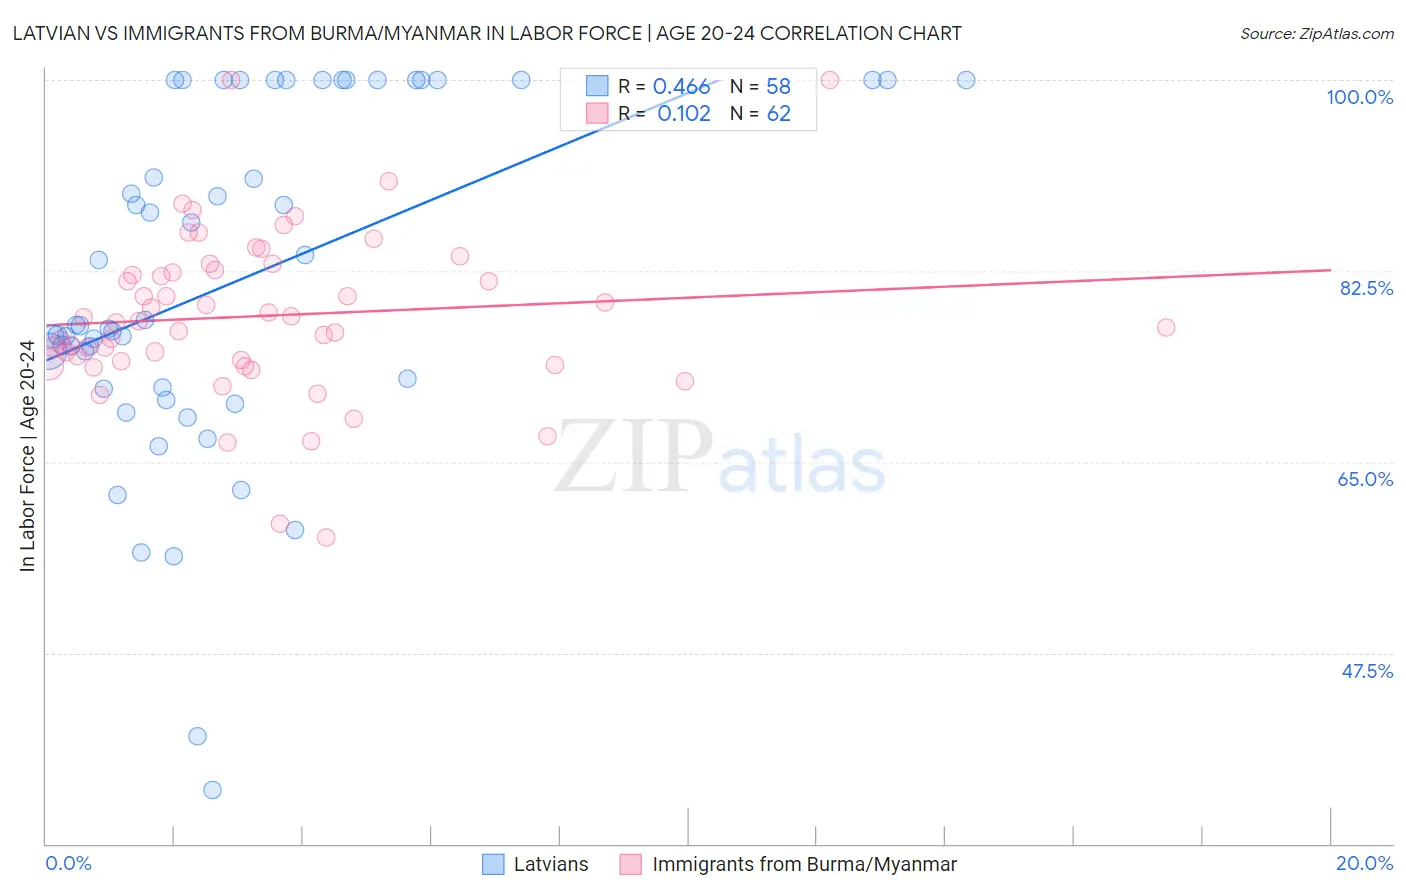
Latvian vs Immigrants from Burma/Myanmar In Labor Force | Age 20-24 Correlation Chart
The statistical analysis conducted on geographies consisting of 220,651,647 people shows a moderate positive correlation between the proportion of Latvians and labor force participation rate among population between the ages 20 and 24 in the United States with a correlation coefficient (R) of 0.466 and weighted average of 76.1%. Similarly, the statistical analysis conducted on geographies consisting of 172,353,766 people shows a poor positive correlation between the proportion of Immigrants from Burma/Myanmar and labor force participation rate among population between the ages 20 and 24 in the United States with a correlation coefficient (R) of 0.102 and weighted average of 76.3%, a difference of 0.34%.
In Labor Force | Age 20-24 Correlation Summary
| Measurement | Latvian | Immigrants from Burma/Myanmar |
| Minimum | 34.9% | 58.1% |
| Maximum | 100.0% | 100.0% |
| Range | 65.1% | 41.9% |
| Mean | 81.5% | 78.4% |
| Median | 77.5% | 77.8% |
| Interquartile 25% (IQ1) | 71.8% | 74.3% |
| Interquartile 75% (IQ3) | 100.0% | 82.6% |
| Interquartile Range (IQR) | 28.2% | 8.3% |
| Standard Deviation (Sample) | 15.9% | 7.6% |
| Standard Deviation (Population) | 15.7% | 7.5% |
Demographics Similar to Latvians and Immigrants from Burma/Myanmar by In Labor Force | Age 20-24
In terms of in labor force | age 20-24, the demographic groups most similar to Latvians are Immigrants from Poland (76.1%, a difference of 0.010%), Shoshone (76.1%, a difference of 0.020%), Immigrants from North Macedonia (76.1%, a difference of 0.020%), American (76.1%, a difference of 0.030%), and Immigrants from Lithuania (76.1%, a difference of 0.060%). Similarly, the demographic groups most similar to Immigrants from Burma/Myanmar are Sierra Leonean (76.3%, a difference of 0.020%), Spanish (76.4%, a difference of 0.050%), Bulgarian (76.4%, a difference of 0.050%), Maltese (76.3%, a difference of 0.050%), and Hungarian (76.3%, a difference of 0.070%).
| Demographics | Rating | Rank | In Labor Force | Age 20-24 |
| Immigrants | Iraq | 99.3 /100 | #86 | Exceptional 76.4% |
| Immigrants | Thailand | 99.3 /100 | #87 | Exceptional 76.4% |
| Spanish | 99.2 /100 | #88 | Exceptional 76.4% |
| Bulgarians | 99.2 /100 | #89 | Exceptional 76.4% |
| Immigrants | Burma/Myanmar | 99.1 /100 | #90 | Exceptional 76.3% |
| Sierra Leoneans | 99.0 /100 | #91 | Exceptional 76.3% |
| Maltese | 98.9 /100 | #92 | Exceptional 76.3% |
| Hungarians | 98.9 /100 | #93 | Exceptional 76.3% |
| Potawatomi | 98.5 /100 | #94 | Exceptional 76.2% |
| Immigrants | Germany | 98.5 /100 | #95 | Exceptional 76.2% |
| Immigrants | Nonimmigrants | 98.5 /100 | #96 | Exceptional 76.2% |
| Immigrants | Lithuania | 98.0 /100 | #97 | Exceptional 76.1% |
| Immigrants | Oceania | 98.0 /100 | #98 | Exceptional 76.1% |
| Americans | 97.8 /100 | #99 | Exceptional 76.1% |
| Shoshone | 97.8 /100 | #100 | Exceptional 76.1% |
| Immigrants | Poland | 97.7 /100 | #101 | Exceptional 76.1% |
| Latvians | 97.6 /100 | #102 | Exceptional 76.1% |
| Immigrants | North Macedonia | 97.5 /100 | #103 | Exceptional 76.1% |
| Macedonians | 97.2 /100 | #104 | Exceptional 76.0% |
| Immigrants | Nepal | 97.2 /100 | #105 | Exceptional 76.0% |
| Immigrants | Uganda | 97.1 /100 | #106 | Exceptional 76.0% |