Latvian vs Cypriot In Labor Force | Age 20-24
COMPARE
Latvian
Cypriot
In Labor Force | Age 20-24
In Labor Force | Age 20-24 Comparison
Latvians
Cypriots
76.1%
IN LABOR FORCE | AGE 20-24
97.6/ 100
METRIC RATING
102nd/ 347
METRIC RANK
73.3%
IN LABOR FORCE | AGE 20-24
0.2/ 100
METRIC RATING
278th/ 347
METRIC RANK
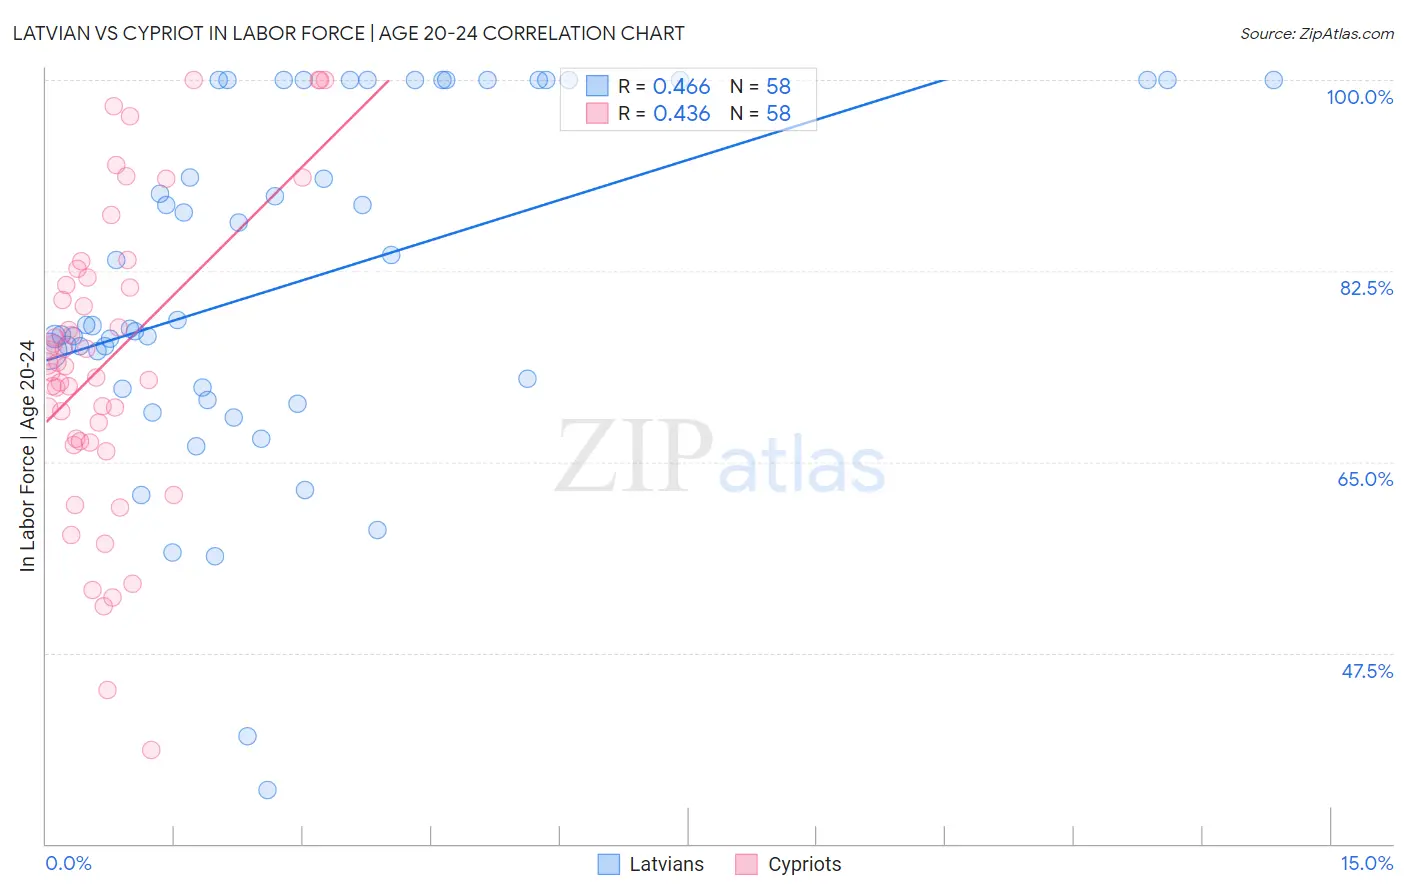
Latvian vs Cypriot In Labor Force | Age 20-24 Correlation Chart
The statistical analysis conducted on geographies consisting of 220,651,647 people shows a moderate positive correlation between the proportion of Latvians and labor force participation rate among population between the ages 20 and 24 in the United States with a correlation coefficient (R) of 0.466 and weighted average of 76.1%. Similarly, the statistical analysis conducted on geographies consisting of 61,866,486 people shows a moderate positive correlation between the proportion of Cypriots and labor force participation rate among population between the ages 20 and 24 in the United States with a correlation coefficient (R) of 0.436 and weighted average of 73.3%, a difference of 3.8%.
In Labor Force | Age 20-24 Correlation Summary
| Measurement | Latvian | Cypriot |
| Minimum | 34.9% | 38.6% |
| Maximum | 100.0% | 100.0% |
| Range | 65.1% | 61.4% |
| Mean | 81.5% | 74.4% |
| Median | 77.5% | 73.9% |
| Interquartile 25% (IQ1) | 71.8% | 66.9% |
| Interquartile 75% (IQ3) | 100.0% | 81.9% |
| Interquartile Range (IQR) | 28.2% | 15.0% |
| Standard Deviation (Sample) | 15.9% | 13.9% |
| Standard Deviation (Population) | 15.7% | 13.8% |
Similar Demographics by In Labor Force | Age 20-24
Demographics Similar to Latvians by In Labor Force | Age 20-24
In terms of in labor force | age 20-24, the demographic groups most similar to Latvians are Immigrants from Poland (76.1%, a difference of 0.010%), Shoshone (76.1%, a difference of 0.020%), Immigrants from North Macedonia (76.1%, a difference of 0.020%), American (76.1%, a difference of 0.030%), and Immigrants from Lithuania (76.1%, a difference of 0.060%).
| Demographics | Rating | Rank | In Labor Force | Age 20-24 |
| Immigrants | Germany | 98.5 /100 | #95 | Exceptional 76.2% |
| Immigrants | Nonimmigrants | 98.5 /100 | #96 | Exceptional 76.2% |
| Immigrants | Lithuania | 98.0 /100 | #97 | Exceptional 76.1% |
| Immigrants | Oceania | 98.0 /100 | #98 | Exceptional 76.1% |
| Americans | 97.8 /100 | #99 | Exceptional 76.1% |
| Shoshone | 97.8 /100 | #100 | Exceptional 76.1% |
| Immigrants | Poland | 97.7 /100 | #101 | Exceptional 76.1% |
| Latvians | 97.6 /100 | #102 | Exceptional 76.1% |
| Immigrants | North Macedonia | 97.5 /100 | #103 | Exceptional 76.1% |
| Macedonians | 97.2 /100 | #104 | Exceptional 76.0% |
| Immigrants | Nepal | 97.2 /100 | #105 | Exceptional 76.0% |
| Immigrants | Uganda | 97.1 /100 | #106 | Exceptional 76.0% |
| Greeks | 96.9 /100 | #107 | Exceptional 76.0% |
| Iraqis | 96.6 /100 | #108 | Exceptional 76.0% |
| Cherokee | 95.8 /100 | #109 | Exceptional 75.9% |
Demographics Similar to Cypriots by In Labor Force | Age 20-24
In terms of in labor force | age 20-24, the demographic groups most similar to Cypriots are Venezuelan (73.3%, a difference of 0.010%), Immigrants from Malaysia (73.3%, a difference of 0.020%), Mongolian (73.3%, a difference of 0.030%), Immigrants from South America (73.3%, a difference of 0.040%), and Bahamian (73.3%, a difference of 0.080%).
| Demographics | Rating | Rank | In Labor Force | Age 20-24 |
| Immigrants | Indonesia | 0.3 /100 | #271 | Tragic 73.4% |
| Belizeans | 0.3 /100 | #272 | Tragic 73.4% |
| Cheyenne | 0.2 /100 | #273 | Tragic 73.4% |
| Immigrants | Colombia | 0.2 /100 | #274 | Tragic 73.4% |
| Immigrants | South America | 0.2 /100 | #275 | Tragic 73.3% |
| Mongolians | 0.2 /100 | #276 | Tragic 73.3% |
| Immigrants | Malaysia | 0.2 /100 | #277 | Tragic 73.3% |
| Cypriots | 0.2 /100 | #278 | Tragic 73.3% |
| Venezuelans | 0.2 /100 | #279 | Tragic 73.3% |
| Bahamians | 0.1 /100 | #280 | Tragic 73.3% |
| Immigrants | Venezuela | 0.1 /100 | #281 | Tragic 73.2% |
| Immigrants | Spain | 0.1 /100 | #282 | Tragic 73.2% |
| Immigrants | Bahamas | 0.1 /100 | #283 | Tragic 73.2% |
| Kiowa | 0.1 /100 | #284 | Tragic 73.2% |
| Nicaraguans | 0.1 /100 | #285 | Tragic 73.2% |