Ghanaian vs Immigrants from Turkey In Labor Force | Age 16-19
COMPARE
Ghanaian
Immigrants from Turkey
In Labor Force | Age 16-19
In Labor Force | Age 16-19 Comparison
Ghanaians
Immigrants from Turkey
35.3%
IN LABOR FORCE | AGE 16-19
6.5/ 100
METRIC RATING
223rd/ 347
METRIC RANK
34.9%
IN LABOR FORCE | AGE 16-19
2.6/ 100
METRIC RATING
244th/ 347
METRIC RANK
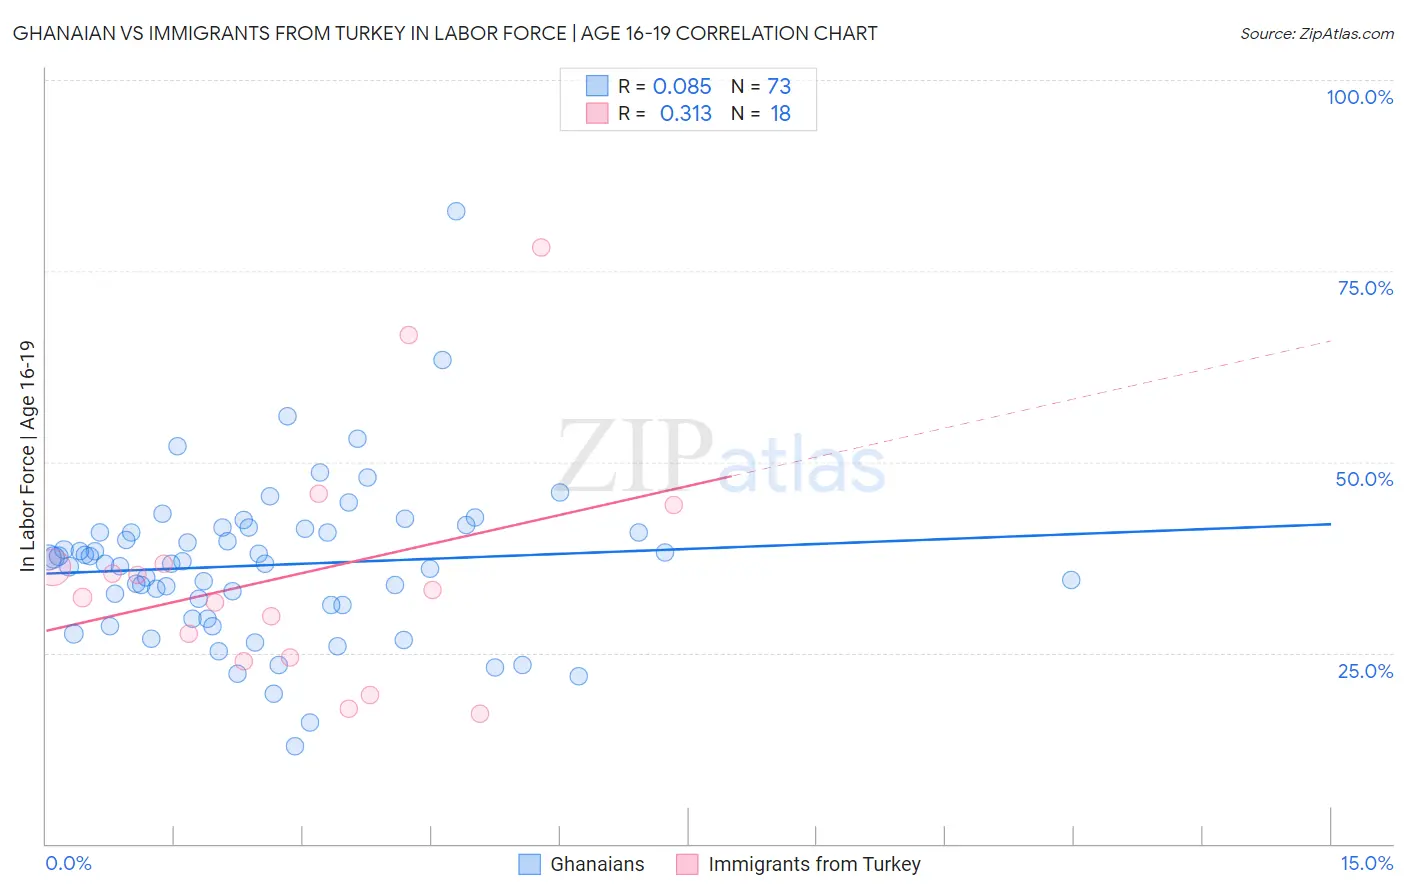
Ghanaian vs Immigrants from Turkey In Labor Force | Age 16-19 Correlation Chart
The statistical analysis conducted on geographies consisting of 190,615,931 people shows a slight positive correlation between the proportion of Ghanaians and labor force participation rate among population between the ages 16 and 19 in the United States with a correlation coefficient (R) of 0.085 and weighted average of 35.3%. Similarly, the statistical analysis conducted on geographies consisting of 222,808,071 people shows a mild positive correlation between the proportion of Immigrants from Turkey and labor force participation rate among population between the ages 16 and 19 in the United States with a correlation coefficient (R) of 0.313 and weighted average of 34.9%, a difference of 1.3%.
In Labor Force | Age 16-19 Correlation Summary
| Measurement | Ghanaian | Immigrants from Turkey |
| Minimum | 12.8% | 17.1% |
| Maximum | 82.8% | 78.1% |
| Range | 70.0% | 61.0% |
| Mean | 36.5% | 35.3% |
| Median | 36.7% | 32.8% |
| Interquartile 25% (IQ1) | 30.3% | 24.3% |
| Interquartile 75% (IQ3) | 41.0% | 36.6% |
| Interquartile Range (IQR) | 10.7% | 12.3% |
| Standard Deviation (Sample) | 10.4% | 15.8% |
| Standard Deviation (Population) | 10.4% | 15.4% |
Similar Demographics by In Labor Force | Age 16-19
Demographics Similar to Ghanaians by In Labor Force | Age 16-19
In terms of in labor force | age 16-19, the demographic groups most similar to Ghanaians are Honduran (35.3%, a difference of 0.020%), Immigrants from Belgium (35.3%, a difference of 0.090%), Immigrants from Ghana (35.4%, a difference of 0.15%), Turkish (35.4%, a difference of 0.16%), and Immigrants from Guatemala (35.3%, a difference of 0.19%).
| Demographics | Rating | Rank | In Labor Force | Age 16-19 |
| Dutch West Indians | 10.7 /100 | #216 | Poor 35.6% |
| Immigrants | Costa Rica | 10.7 /100 | #217 | Poor 35.6% |
| Sri Lankans | 9.8 /100 | #218 | Tragic 35.5% |
| Guatemalans | 8.6 /100 | #219 | Tragic 35.5% |
| Immigrants | Bahamas | 8.3 /100 | #220 | Tragic 35.5% |
| Turks | 7.3 /100 | #221 | Tragic 35.4% |
| Immigrants | Ghana | 7.3 /100 | #222 | Tragic 35.4% |
| Ghanaians | 6.5 /100 | #223 | Tragic 35.3% |
| Hondurans | 6.5 /100 | #224 | Tragic 35.3% |
| Immigrants | Belgium | 6.1 /100 | #225 | Tragic 35.3% |
| Immigrants | Guatemala | 5.7 /100 | #226 | Tragic 35.3% |
| Mongolians | 5.7 /100 | #227 | Tragic 35.3% |
| Immigrants | Senegal | 5.5 /100 | #228 | Tragic 35.3% |
| Immigrants | Lebanon | 5.0 /100 | #229 | Tragic 35.2% |
| Immigrants | Honduras | 4.9 /100 | #230 | Tragic 35.2% |
Demographics Similar to Immigrants from Turkey by In Labor Force | Age 16-19
In terms of in labor force | age 16-19, the demographic groups most similar to Immigrants from Turkey are Pueblo (34.9%, a difference of 0.020%), Uruguayan (34.9%, a difference of 0.050%), Immigrants from Greece (34.9%, a difference of 0.060%), Immigrants from Sri Lanka (34.9%, a difference of 0.080%), and Laotian (34.9%, a difference of 0.090%).
| Demographics | Rating | Rank | In Labor Force | Age 16-19 |
| Immigrants | India | 3.5 /100 | #237 | Tragic 35.0% |
| Immigrants | Vietnam | 3.4 /100 | #238 | Tragic 35.0% |
| Inupiat | 3.2 /100 | #239 | Tragic 35.0% |
| Immigrants | Central America | 3.0 /100 | #240 | Tragic 35.0% |
| Immigrants | Ireland | 2.9 /100 | #241 | Tragic 35.0% |
| Uruguayans | 2.6 /100 | #242 | Tragic 34.9% |
| Pueblo | 2.6 /100 | #243 | Tragic 34.9% |
| Immigrants | Turkey | 2.6 /100 | #244 | Tragic 34.9% |
| Immigrants | Greece | 2.4 /100 | #245 | Tragic 34.9% |
| Immigrants | Sri Lanka | 2.4 /100 | #246 | Tragic 34.9% |
| Laotians | 2.4 /100 | #247 | Tragic 34.9% |
| Central Americans | 2.2 /100 | #248 | Tragic 34.8% |
| Immigrants | Ukraine | 2.2 /100 | #249 | Tragic 34.8% |
| Immigrants | Pakistan | 2.0 /100 | #250 | Tragic 34.8% |
| Immigrants | Western Asia | 2.0 /100 | #251 | Tragic 34.8% |