Indonesian vs Immigrants from Turkey In Labor Force | Age 16-19
COMPARE
Indonesian
Immigrants from Turkey
In Labor Force | Age 16-19
In Labor Force | Age 16-19 Comparison
Indonesians
Immigrants from Turkey
40.7%
IN LABOR FORCE | AGE 16-19
100.0/ 100
METRIC RATING
50th/ 347
METRIC RANK
34.9%
IN LABOR FORCE | AGE 16-19
2.6/ 100
METRIC RATING
244th/ 347
METRIC RANK
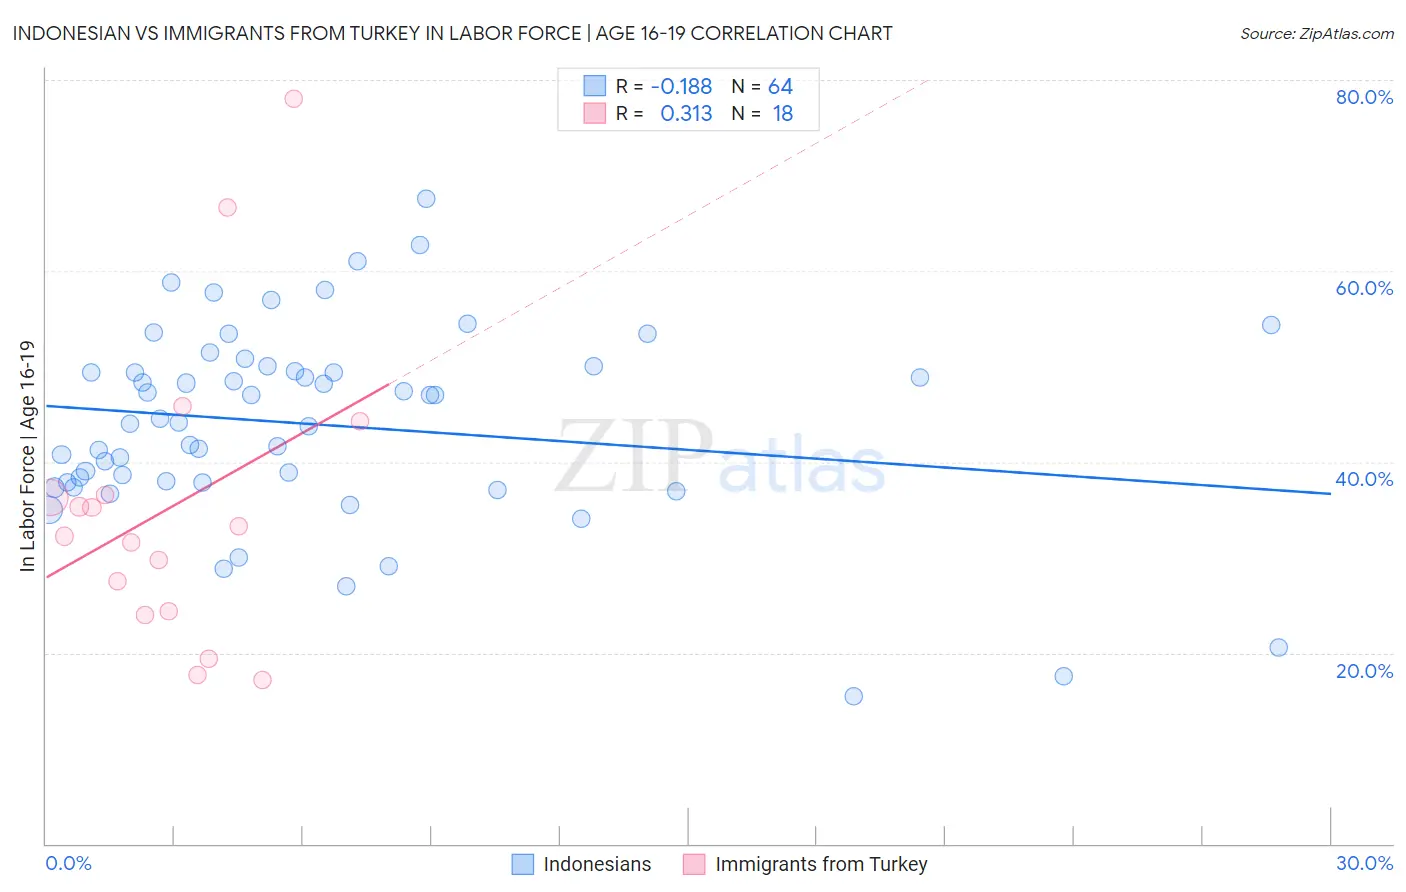
Indonesian vs Immigrants from Turkey In Labor Force | Age 16-19 Correlation Chart
The statistical analysis conducted on geographies consisting of 162,704,149 people shows a poor negative correlation between the proportion of Indonesians and labor force participation rate among population between the ages 16 and 19 in the United States with a correlation coefficient (R) of -0.188 and weighted average of 40.7%. Similarly, the statistical analysis conducted on geographies consisting of 222,808,071 people shows a mild positive correlation between the proportion of Immigrants from Turkey and labor force participation rate among population between the ages 16 and 19 in the United States with a correlation coefficient (R) of 0.313 and weighted average of 34.9%, a difference of 16.7%.
In Labor Force | Age 16-19 Correlation Summary
| Measurement | Indonesian | Immigrants from Turkey |
| Minimum | 15.4% | 17.1% |
| Maximum | 67.6% | 78.1% |
| Range | 52.2% | 61.0% |
| Mean | 43.9% | 35.3% |
| Median | 44.3% | 32.8% |
| Interquartile 25% (IQ1) | 37.8% | 24.3% |
| Interquartile 75% (IQ3) | 49.8% | 36.6% |
| Interquartile Range (IQR) | 11.9% | 12.3% |
| Standard Deviation (Sample) | 10.3% | 15.8% |
| Standard Deviation (Population) | 10.2% | 15.4% |
Similar Demographics by In Labor Force | Age 16-19
Demographics Similar to Indonesians by In Labor Force | Age 16-19
In terms of in labor force | age 16-19, the demographic groups most similar to Indonesians are Immigrants from Zaire (40.7%, a difference of 0.10%), Cree (40.8%, a difference of 0.16%), Icelander (40.8%, a difference of 0.18%), Immigrants from Laos (40.6%, a difference of 0.19%), and Carpatho Rusyn (40.8%, a difference of 0.23%).
| Demographics | Rating | Rank | In Labor Force | Age 16-19 |
| Tongans | 100.0 /100 | #43 | Exceptional 41.2% |
| Europeans | 100.0 /100 | #44 | Exceptional 41.1% |
| Croatians | 100.0 /100 | #45 | Exceptional 41.1% |
| Immigrants | Sudan | 100.0 /100 | #46 | Exceptional 41.0% |
| Carpatho Rusyns | 100.0 /100 | #47 | Exceptional 40.8% |
| Icelanders | 100.0 /100 | #48 | Exceptional 40.8% |
| Cree | 100.0 /100 | #49 | Exceptional 40.8% |
| Indonesians | 100.0 /100 | #50 | Exceptional 40.7% |
| Immigrants | Zaire | 100.0 /100 | #51 | Exceptional 40.7% |
| Immigrants | Laos | 100.0 /100 | #52 | Exceptional 40.6% |
| Immigrants | Kenya | 100.0 /100 | #53 | Exceptional 40.5% |
| Tlingit-Haida | 100.0 /100 | #54 | Exceptional 40.5% |
| British | 100.0 /100 | #55 | Exceptional 40.5% |
| Fijians | 100.0 /100 | #56 | Exceptional 40.4% |
| Lithuanians | 100.0 /100 | #57 | Exceptional 40.4% |
Demographics Similar to Immigrants from Turkey by In Labor Force | Age 16-19
In terms of in labor force | age 16-19, the demographic groups most similar to Immigrants from Turkey are Pueblo (34.9%, a difference of 0.020%), Uruguayan (34.9%, a difference of 0.050%), Immigrants from Greece (34.9%, a difference of 0.060%), Immigrants from Sri Lanka (34.9%, a difference of 0.080%), and Laotian (34.9%, a difference of 0.090%).
| Demographics | Rating | Rank | In Labor Force | Age 16-19 |
| Immigrants | India | 3.5 /100 | #237 | Tragic 35.0% |
| Immigrants | Vietnam | 3.4 /100 | #238 | Tragic 35.0% |
| Inupiat | 3.2 /100 | #239 | Tragic 35.0% |
| Immigrants | Central America | 3.0 /100 | #240 | Tragic 35.0% |
| Immigrants | Ireland | 2.9 /100 | #241 | Tragic 35.0% |
| Uruguayans | 2.6 /100 | #242 | Tragic 34.9% |
| Pueblo | 2.6 /100 | #243 | Tragic 34.9% |
| Immigrants | Turkey | 2.6 /100 | #244 | Tragic 34.9% |
| Immigrants | Greece | 2.4 /100 | #245 | Tragic 34.9% |
| Immigrants | Sri Lanka | 2.4 /100 | #246 | Tragic 34.9% |
| Laotians | 2.4 /100 | #247 | Tragic 34.9% |
| Central Americans | 2.2 /100 | #248 | Tragic 34.8% |
| Immigrants | Ukraine | 2.2 /100 | #249 | Tragic 34.8% |
| Immigrants | Pakistan | 2.0 /100 | #250 | Tragic 34.8% |
| Immigrants | Western Asia | 2.0 /100 | #251 | Tragic 34.8% |