Laotian vs Immigrants from Syria In Labor Force | Age 20-64
COMPARE
Laotian
Immigrants from Syria
In Labor Force | Age 20-64
In Labor Force | Age 20-64 Comparison
Laotians
Immigrants from Syria
79.6%
IN LABOR FORCE | AGE 20-64
58.4/ 100
METRIC RATING
169th/ 347
METRIC RANK
79.4%
IN LABOR FORCE | AGE 20-64
30.8/ 100
METRIC RATING
190th/ 347
METRIC RANK
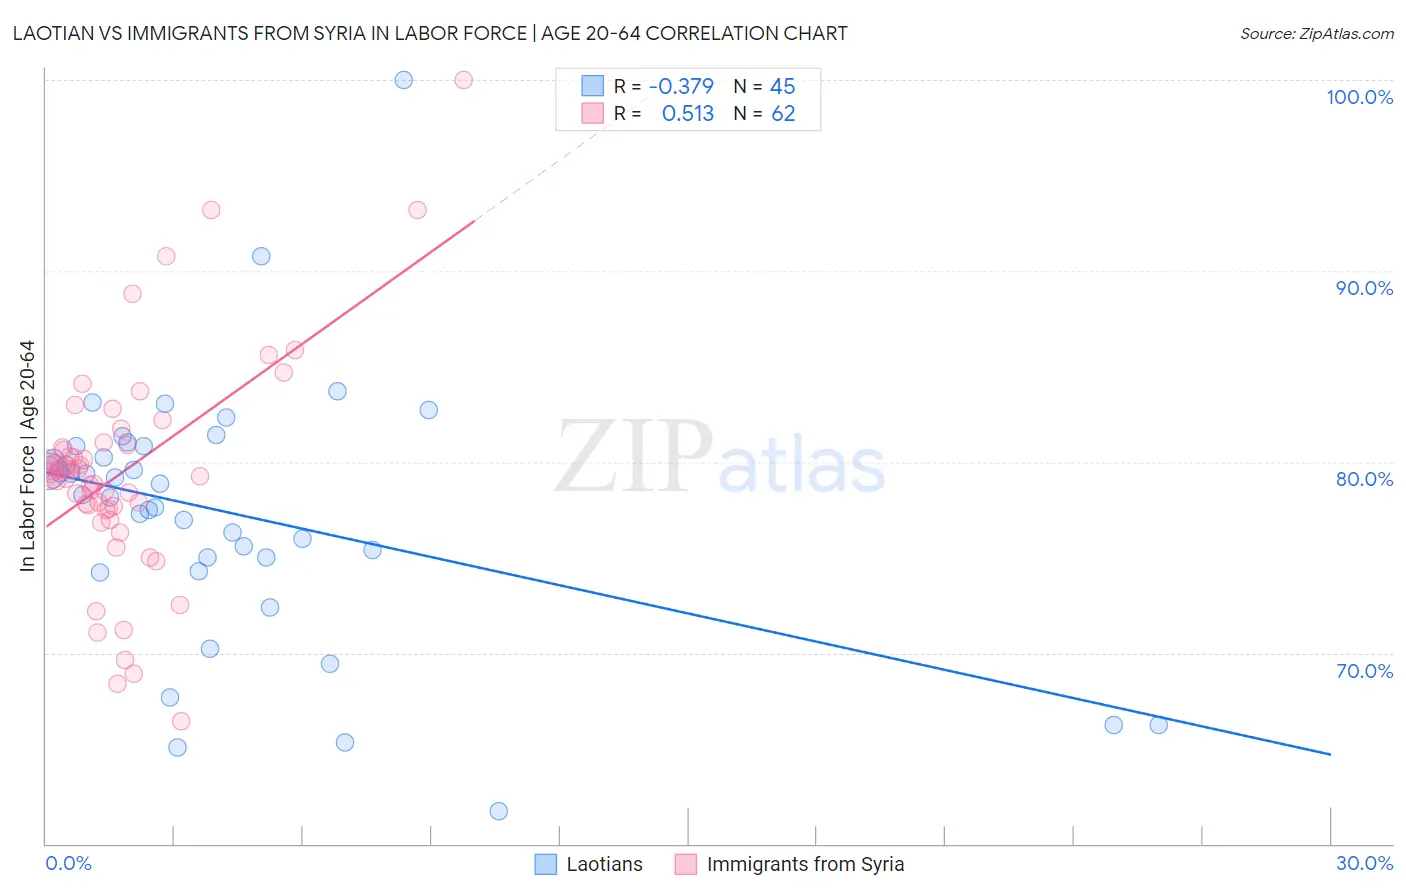
Laotian vs Immigrants from Syria In Labor Force | Age 20-64 Correlation Chart
The statistical analysis conducted on geographies consisting of 224,862,184 people shows a mild negative correlation between the proportion of Laotians and labor force participation rate among population between the ages 20 and 64 in the United States with a correlation coefficient (R) of -0.379 and weighted average of 79.6%. Similarly, the statistical analysis conducted on geographies consisting of 174,112,677 people shows a substantial positive correlation between the proportion of Immigrants from Syria and labor force participation rate among population between the ages 20 and 64 in the United States with a correlation coefficient (R) of 0.513 and weighted average of 79.4%, a difference of 0.23%.
In Labor Force | Age 20-64 Correlation Summary
| Measurement | Laotian | Immigrants from Syria |
| Minimum | 61.7% | 66.4% |
| Maximum | 100.0% | 100.0% |
| Range | 38.3% | 33.6% |
| Mean | 77.3% | 79.5% |
| Median | 78.3% | 79.4% |
| Interquartile 25% (IQ1) | 74.7% | 77.6% |
| Interquartile 75% (IQ3) | 80.8% | 80.9% |
| Interquartile Range (IQR) | 6.2% | 3.3% |
| Standard Deviation (Sample) | 6.8% | 5.8% |
| Standard Deviation (Population) | 6.7% | 5.8% |
Similar Demographics by In Labor Force | Age 20-64
Demographics Similar to Laotians by In Labor Force | Age 20-64
In terms of in labor force | age 20-64, the demographic groups most similar to Laotians are Immigrants from Iraq (79.6%, a difference of 0.030%), Immigrants from Indonesia (79.6%, a difference of 0.030%), Okinawan (79.6%, a difference of 0.040%), Slavic (79.6%, a difference of 0.040%), and Immigrants from Switzerland (79.6%, a difference of 0.040%).
| Demographics | Rating | Rank | In Labor Force | Age 20-64 |
| Germans | 65.2 /100 | #162 | Good 79.7% |
| Immigrants | Costa Rica | 64.6 /100 | #163 | Good 79.7% |
| Immigrants | Burma/Myanmar | 64.4 /100 | #164 | Good 79.7% |
| Nigerians | 64.0 /100 | #165 | Good 79.7% |
| Okinawans | 62.7 /100 | #166 | Good 79.6% |
| Immigrants | Iraq | 62.0 /100 | #167 | Good 79.6% |
| Immigrants | Indonesia | 61.8 /100 | #168 | Good 79.6% |
| Laotians | 58.4 /100 | #169 | Average 79.6% |
| Slavs | 54.0 /100 | #170 | Average 79.6% |
| Immigrants | Switzerland | 53.3 /100 | #171 | Average 79.6% |
| Immigrants | Belgium | 53.1 /100 | #172 | Average 79.6% |
| Immigrants | Scotland | 52.4 /100 | #173 | Average 79.6% |
| Syrians | 50.0 /100 | #174 | Average 79.6% |
| Cubans | 46.1 /100 | #175 | Average 79.5% |
| Australians | 46.0 /100 | #176 | Average 79.5% |
Demographics Similar to Immigrants from Syria by In Labor Force | Age 20-64
In terms of in labor force | age 20-64, the demographic groups most similar to Immigrants from Syria are Immigrants from El Salvador (79.4%, a difference of 0.0%), Immigrants from Haiti (79.4%, a difference of 0.010%), Assyrian/Chaldean/Syriac (79.4%, a difference of 0.020%), Swiss (79.4%, a difference of 0.020%), and Northern European (79.5%, a difference of 0.030%).
| Demographics | Rating | Rank | In Labor Force | Age 20-64 |
| Immigrants | Hungary | 36.8 /100 | #183 | Fair 79.5% |
| Finns | 35.9 /100 | #184 | Fair 79.5% |
| Israelis | 34.7 /100 | #185 | Fair 79.5% |
| Northern Europeans | 34.5 /100 | #186 | Fair 79.5% |
| Assyrians/Chaldeans/Syriacs | 33.3 /100 | #187 | Fair 79.4% |
| Immigrants | Haiti | 32.1 /100 | #188 | Fair 79.4% |
| Immigrants | El Salvador | 30.9 /100 | #189 | Fair 79.4% |
| Immigrants | Syria | 30.8 /100 | #190 | Fair 79.4% |
| Swiss | 28.9 /100 | #191 | Fair 79.4% |
| Immigrants | Denmark | 26.9 /100 | #192 | Fair 79.4% |
| Indonesians | 26.1 /100 | #193 | Fair 79.4% |
| Immigrants | Thailand | 24.8 /100 | #194 | Fair 79.4% |
| Immigrants | Austria | 23.7 /100 | #195 | Fair 79.4% |
| Ecuadorians | 23.1 /100 | #196 | Fair 79.4% |
| Immigrants | Senegal | 22.5 /100 | #197 | Fair 79.4% |