Immigrants from Ireland vs Immigrants from Syria In Labor Force | Age 20-64
COMPARE
Immigrants from Ireland
Immigrants from Syria
In Labor Force | Age 20-64
In Labor Force | Age 20-64 Comparison
Immigrants from Ireland
Immigrants from Syria
80.7%
IN LABOR FORCE | AGE 20-64
99.9/ 100
METRIC RATING
32nd/ 347
METRIC RANK
79.4%
IN LABOR FORCE | AGE 20-64
30.8/ 100
METRIC RATING
190th/ 347
METRIC RANK
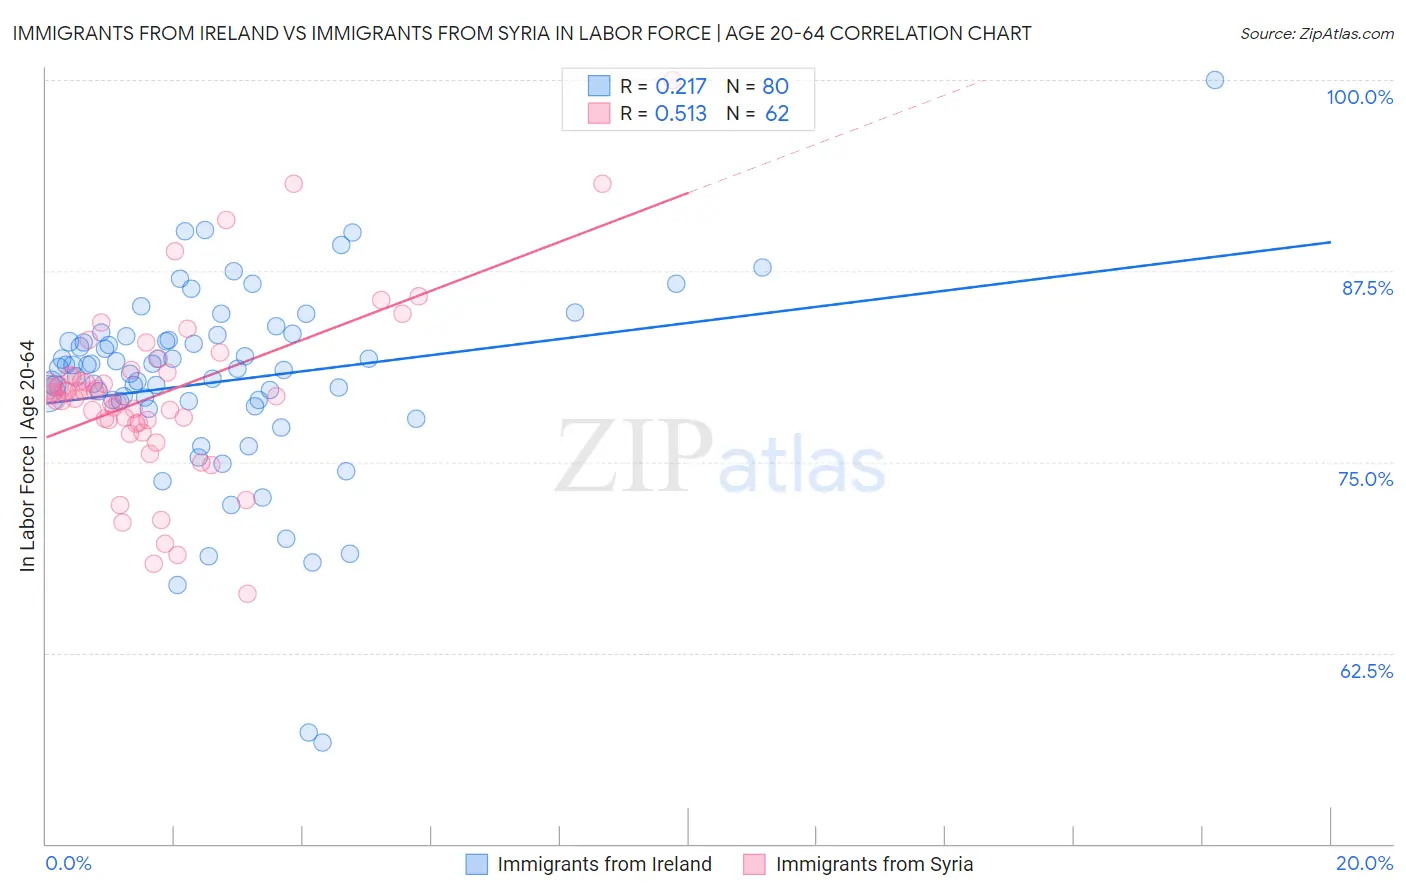
Immigrants from Ireland vs Immigrants from Syria In Labor Force | Age 20-64 Correlation Chart
The statistical analysis conducted on geographies consisting of 240,784,168 people shows a weak positive correlation between the proportion of Immigrants from Ireland and labor force participation rate among population between the ages 20 and 64 in the United States with a correlation coefficient (R) of 0.217 and weighted average of 80.7%. Similarly, the statistical analysis conducted on geographies consisting of 174,112,677 people shows a substantial positive correlation between the proportion of Immigrants from Syria and labor force participation rate among population between the ages 20 and 64 in the United States with a correlation coefficient (R) of 0.513 and weighted average of 79.4%, a difference of 1.6%.
In Labor Force | Age 20-64 Correlation Summary
| Measurement | Immigrants from Ireland | Immigrants from Syria |
| Minimum | 56.6% | 66.4% |
| Maximum | 100.0% | 100.0% |
| Range | 43.4% | 33.6% |
| Mean | 80.3% | 79.5% |
| Median | 81.1% | 79.4% |
| Interquartile 25% (IQ1) | 79.0% | 77.6% |
| Interquartile 75% (IQ3) | 83.1% | 80.9% |
| Interquartile Range (IQR) | 4.1% | 3.3% |
| Standard Deviation (Sample) | 6.5% | 5.8% |
| Standard Deviation (Population) | 6.4% | 5.8% |
Similar Demographics by In Labor Force | Age 20-64
Demographics Similar to Immigrants from Ireland by In Labor Force | Age 20-64
In terms of in labor force | age 20-64, the demographic groups most similar to Immigrants from Ireland are Immigrants from Lithuania (80.7%, a difference of 0.010%), Immigrants from South Central Asia (80.7%, a difference of 0.030%), Immigrants from North Macedonia (80.7%, a difference of 0.030%), Chinese (80.7%, a difference of 0.030%), and Immigrants from Uganda (80.7%, a difference of 0.050%).
| Demographics | Rating | Rank | In Labor Force | Age 20-64 |
| Kenyans | 100.0 /100 | #25 | Exceptional 80.8% |
| Immigrants | Serbia | 100.0 /100 | #26 | Exceptional 80.8% |
| Immigrants | Kenya | 99.9 /100 | #27 | Exceptional 80.7% |
| Immigrants | Uganda | 99.9 /100 | #28 | Exceptional 80.7% |
| Immigrants | South Central Asia | 99.9 /100 | #29 | Exceptional 80.7% |
| Immigrants | North Macedonia | 99.9 /100 | #30 | Exceptional 80.7% |
| Immigrants | Lithuania | 99.9 /100 | #31 | Exceptional 80.7% |
| Immigrants | Ireland | 99.9 /100 | #32 | Exceptional 80.7% |
| Chinese | 99.9 /100 | #33 | Exceptional 80.7% |
| Immigrants | Brazil | 99.9 /100 | #34 | Exceptional 80.7% |
| Immigrants | Poland | 99.9 /100 | #35 | Exceptional 80.6% |
| Paraguayans | 99.8 /100 | #36 | Exceptional 80.6% |
| Immigrants | Moldova | 99.8 /100 | #37 | Exceptional 80.6% |
| Ugandans | 99.8 /100 | #38 | Exceptional 80.6% |
| Brazilians | 99.8 /100 | #39 | Exceptional 80.5% |
Demographics Similar to Immigrants from Syria by In Labor Force | Age 20-64
In terms of in labor force | age 20-64, the demographic groups most similar to Immigrants from Syria are Immigrants from El Salvador (79.4%, a difference of 0.0%), Immigrants from Haiti (79.4%, a difference of 0.010%), Assyrian/Chaldean/Syriac (79.4%, a difference of 0.020%), Swiss (79.4%, a difference of 0.020%), and Northern European (79.5%, a difference of 0.030%).
| Demographics | Rating | Rank | In Labor Force | Age 20-64 |
| Immigrants | Hungary | 36.8 /100 | #183 | Fair 79.5% |
| Finns | 35.9 /100 | #184 | Fair 79.5% |
| Israelis | 34.7 /100 | #185 | Fair 79.5% |
| Northern Europeans | 34.5 /100 | #186 | Fair 79.5% |
| Assyrians/Chaldeans/Syriacs | 33.3 /100 | #187 | Fair 79.4% |
| Immigrants | Haiti | 32.1 /100 | #188 | Fair 79.4% |
| Immigrants | El Salvador | 30.9 /100 | #189 | Fair 79.4% |
| Immigrants | Syria | 30.8 /100 | #190 | Fair 79.4% |
| Swiss | 28.9 /100 | #191 | Fair 79.4% |
| Immigrants | Denmark | 26.9 /100 | #192 | Fair 79.4% |
| Indonesians | 26.1 /100 | #193 | Fair 79.4% |
| Immigrants | Thailand | 24.8 /100 | #194 | Fair 79.4% |
| Immigrants | Austria | 23.7 /100 | #195 | Fair 79.4% |
| Ecuadorians | 23.1 /100 | #196 | Fair 79.4% |
| Immigrants | Senegal | 22.5 /100 | #197 | Fair 79.4% |