Yuman vs Immigrants from Syria In Labor Force | Age 20-64
COMPARE
Yuman
Immigrants from Syria
In Labor Force | Age 20-64
In Labor Force | Age 20-64 Comparison
Yuman
Immigrants from Syria
71.7%
IN LABOR FORCE | AGE 20-64
0.0/ 100
METRIC RATING
342nd/ 347
METRIC RANK
79.4%
IN LABOR FORCE | AGE 20-64
30.8/ 100
METRIC RATING
190th/ 347
METRIC RANK
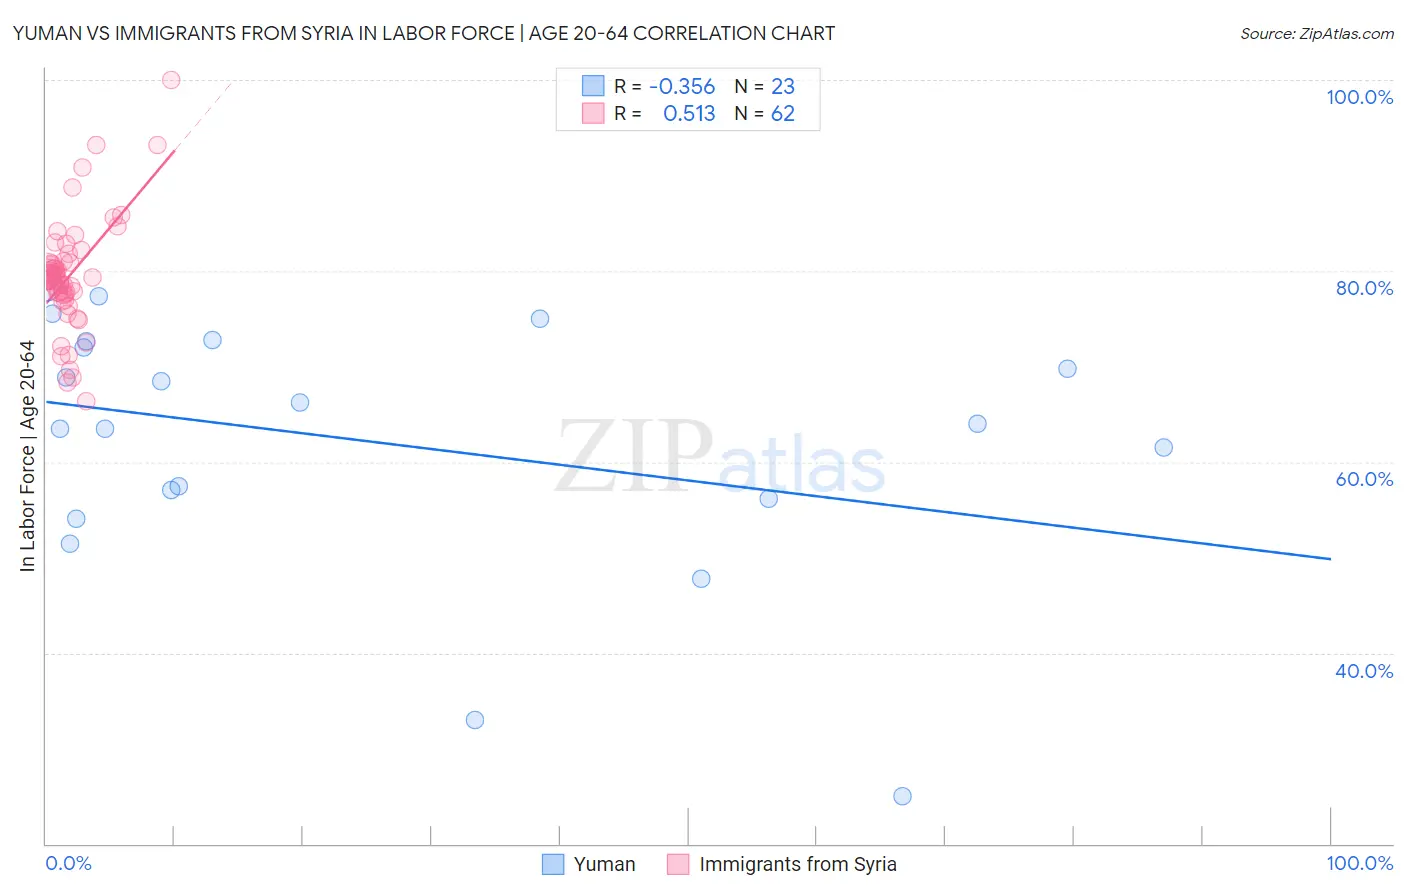
Yuman vs Immigrants from Syria In Labor Force | Age 20-64 Correlation Chart
The statistical analysis conducted on geographies consisting of 40,686,052 people shows a mild negative correlation between the proportion of Yuman and labor force participation rate among population between the ages 20 and 64 in the United States with a correlation coefficient (R) of -0.356 and weighted average of 71.7%. Similarly, the statistical analysis conducted on geographies consisting of 174,112,677 people shows a substantial positive correlation between the proportion of Immigrants from Syria and labor force participation rate among population between the ages 20 and 64 in the United States with a correlation coefficient (R) of 0.513 and weighted average of 79.4%, a difference of 10.7%.
In Labor Force | Age 20-64 Correlation Summary
| Measurement | Yuman | Immigrants from Syria |
| Minimum | 25.0% | 66.4% |
| Maximum | 78.4% | 100.0% |
| Range | 53.4% | 33.6% |
| Mean | 62.2% | 79.5% |
| Median | 64.0% | 79.4% |
| Interquartile 25% (IQ1) | 56.1% | 77.6% |
| Interquartile 75% (IQ3) | 72.6% | 80.9% |
| Interquartile Range (IQR) | 16.5% | 3.3% |
| Standard Deviation (Sample) | 13.5% | 5.8% |
| Standard Deviation (Population) | 13.2% | 5.8% |
Similar Demographics by In Labor Force | Age 20-64
Demographics Similar to Yuman by In Labor Force | Age 20-64
In terms of in labor force | age 20-64, the demographic groups most similar to Yuman are Hopi (71.7%, a difference of 0.020%), Immigrants from Yemen (72.3%, a difference of 0.78%), Pueblo (72.6%, a difference of 1.3%), Houma (72.7%, a difference of 1.4%), and Lumbee (70.6%, a difference of 1.5%).
| Demographics | Rating | Rank | In Labor Force | Age 20-64 |
| Natives/Alaskans | 0.0 /100 | #333 | Tragic 73.9% |
| Apache | 0.0 /100 | #334 | Tragic 73.7% |
| Ute | 0.0 /100 | #335 | Tragic 73.7% |
| Crow | 0.0 /100 | #336 | Tragic 73.3% |
| Yup'ik | 0.0 /100 | #337 | Tragic 73.2% |
| Puerto Ricans | 0.0 /100 | #338 | Tragic 73.1% |
| Houma | 0.0 /100 | #339 | Tragic 72.7% |
| Pueblo | 0.0 /100 | #340 | Tragic 72.6% |
| Immigrants | Yemen | 0.0 /100 | #341 | Tragic 72.3% |
| Yuman | 0.0 /100 | #342 | Tragic 71.7% |
| Hopi | 0.0 /100 | #343 | Tragic 71.7% |
| Lumbee | 0.0 /100 | #344 | Tragic 70.6% |
| Tohono O'odham | 0.0 /100 | #345 | Tragic 70.4% |
| Navajo | 0.0 /100 | #346 | Tragic 69.2% |
| Pima | 0.0 /100 | #347 | Tragic 69.0% |
Demographics Similar to Immigrants from Syria by In Labor Force | Age 20-64
In terms of in labor force | age 20-64, the demographic groups most similar to Immigrants from Syria are Immigrants from El Salvador (79.4%, a difference of 0.0%), Immigrants from Haiti (79.4%, a difference of 0.010%), Assyrian/Chaldean/Syriac (79.4%, a difference of 0.020%), Swiss (79.4%, a difference of 0.020%), and Northern European (79.5%, a difference of 0.030%).
| Demographics | Rating | Rank | In Labor Force | Age 20-64 |
| Immigrants | Hungary | 36.8 /100 | #183 | Fair 79.5% |
| Finns | 35.9 /100 | #184 | Fair 79.5% |
| Israelis | 34.7 /100 | #185 | Fair 79.5% |
| Northern Europeans | 34.5 /100 | #186 | Fair 79.5% |
| Assyrians/Chaldeans/Syriacs | 33.3 /100 | #187 | Fair 79.4% |
| Immigrants | Haiti | 32.1 /100 | #188 | Fair 79.4% |
| Immigrants | El Salvador | 30.9 /100 | #189 | Fair 79.4% |
| Immigrants | Syria | 30.8 /100 | #190 | Fair 79.4% |
| Swiss | 28.9 /100 | #191 | Fair 79.4% |
| Immigrants | Denmark | 26.9 /100 | #192 | Fair 79.4% |
| Indonesians | 26.1 /100 | #193 | Fair 79.4% |
| Immigrants | Thailand | 24.8 /100 | #194 | Fair 79.4% |
| Immigrants | Austria | 23.7 /100 | #195 | Fair 79.4% |
| Ecuadorians | 23.1 /100 | #196 | Fair 79.4% |
| Immigrants | Senegal | 22.5 /100 | #197 | Fair 79.4% |