Scotch-Irish vs Immigrants from Syria In Labor Force | Age 20-64
COMPARE
Scotch-Irish
Immigrants from Syria
In Labor Force | Age 20-64
In Labor Force | Age 20-64 Comparison
Scotch-Irish
Immigrants from Syria
78.3%
IN LABOR FORCE | AGE 20-64
0.0/ 100
METRIC RATING
270th/ 347
METRIC RANK
79.4%
IN LABOR FORCE | AGE 20-64
30.8/ 100
METRIC RATING
190th/ 347
METRIC RANK
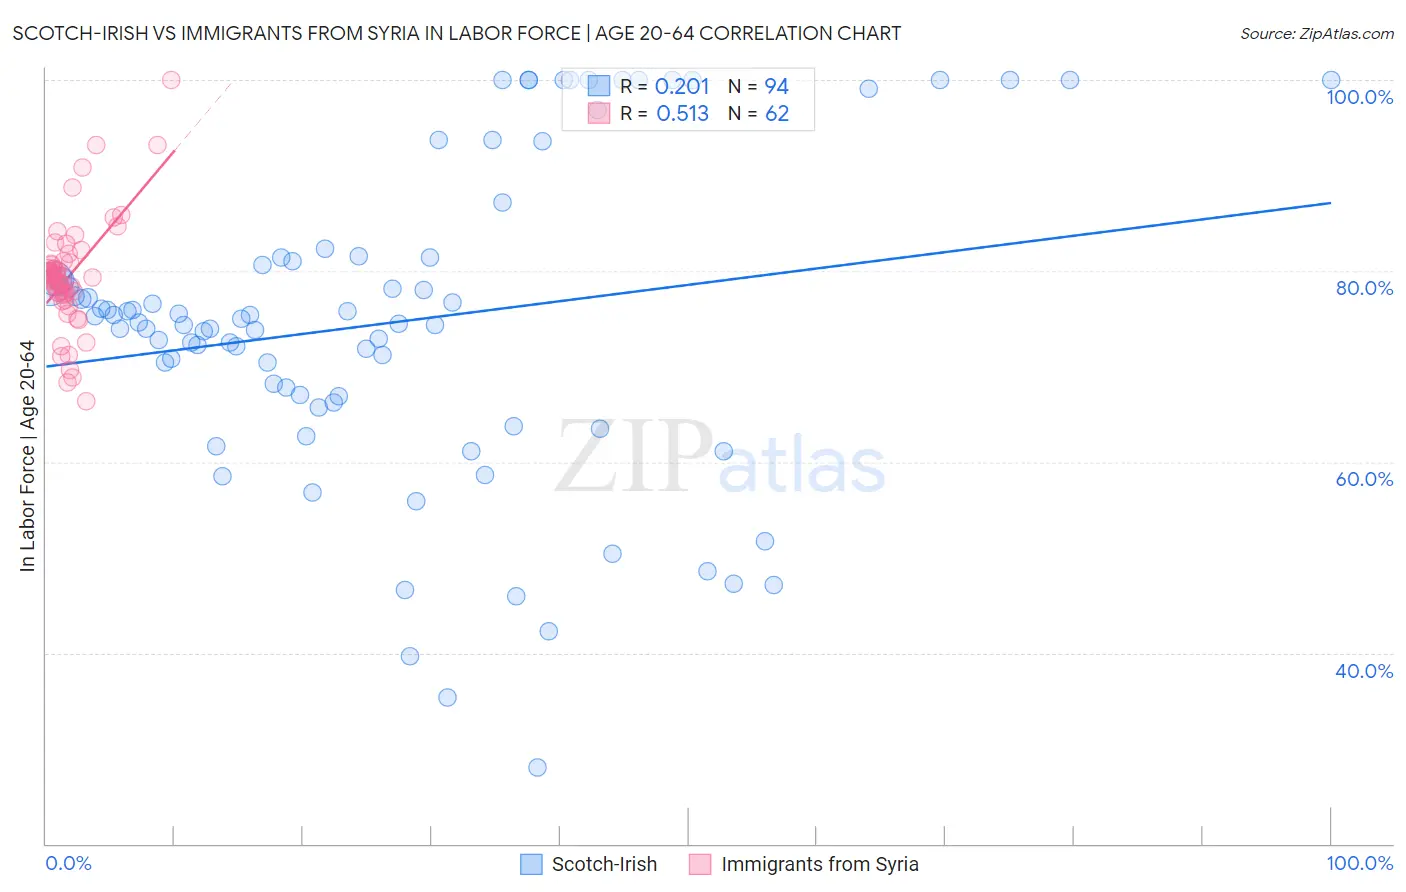
Scotch-Irish vs Immigrants from Syria In Labor Force | Age 20-64 Correlation Chart
The statistical analysis conducted on geographies consisting of 548,766,362 people shows a weak positive correlation between the proportion of Scotch-Irish and labor force participation rate among population between the ages 20 and 64 in the United States with a correlation coefficient (R) of 0.201 and weighted average of 78.3%. Similarly, the statistical analysis conducted on geographies consisting of 174,112,677 people shows a substantial positive correlation between the proportion of Immigrants from Syria and labor force participation rate among population between the ages 20 and 64 in the United States with a correlation coefficient (R) of 0.513 and weighted average of 79.4%, a difference of 1.5%.
In Labor Force | Age 20-64 Correlation Summary
| Measurement | Scotch-Irish | Immigrants from Syria |
| Minimum | 28.0% | 66.4% |
| Maximum | 100.0% | 100.0% |
| Range | 72.0% | 33.6% |
| Mean | 74.6% | 79.5% |
| Median | 74.8% | 79.4% |
| Interquartile 25% (IQ1) | 66.9% | 77.6% |
| Interquartile 75% (IQ3) | 81.3% | 80.9% |
| Interquartile Range (IQR) | 14.5% | 3.3% |
| Standard Deviation (Sample) | 16.5% | 5.8% |
| Standard Deviation (Population) | 16.4% | 5.8% |
Similar Demographics by In Labor Force | Age 20-64
Demographics Similar to Scotch-Irish by In Labor Force | Age 20-64
In terms of in labor force | age 20-64, the demographic groups most similar to Scotch-Irish are Immigrants from Barbados (78.3%, a difference of 0.020%), Immigrants from Latin America (78.3%, a difference of 0.020%), Marshallese (78.3%, a difference of 0.020%), French American Indian (78.2%, a difference of 0.070%), and West Indian (78.3%, a difference of 0.080%).
| Demographics | Rating | Rank | In Labor Force | Age 20-64 |
| Pennsylvania Germans | 0.1 /100 | #263 | Tragic 78.4% |
| Spaniards | 0.1 /100 | #264 | Tragic 78.4% |
| British West Indians | 0.1 /100 | #265 | Tragic 78.4% |
| Bahamians | 0.1 /100 | #266 | Tragic 78.4% |
| U.S. Virgin Islanders | 0.1 /100 | #267 | Tragic 78.4% |
| West Indians | 0.0 /100 | #268 | Tragic 78.3% |
| Immigrants | Barbados | 0.0 /100 | #269 | Tragic 78.3% |
| Scotch-Irish | 0.0 /100 | #270 | Tragic 78.3% |
| Immigrants | Latin America | 0.0 /100 | #271 | Tragic 78.3% |
| Marshallese | 0.0 /100 | #272 | Tragic 78.3% |
| French American Indians | 0.0 /100 | #273 | Tragic 78.2% |
| Aleuts | 0.0 /100 | #274 | Tragic 78.2% |
| Spanish | 0.0 /100 | #275 | Tragic 78.2% |
| Puget Sound Salish | 0.0 /100 | #276 | Tragic 78.2% |
| Immigrants | Bahamas | 0.0 /100 | #277 | Tragic 78.2% |
Demographics Similar to Immigrants from Syria by In Labor Force | Age 20-64
In terms of in labor force | age 20-64, the demographic groups most similar to Immigrants from Syria are Immigrants from El Salvador (79.4%, a difference of 0.0%), Immigrants from Haiti (79.4%, a difference of 0.010%), Assyrian/Chaldean/Syriac (79.4%, a difference of 0.020%), Swiss (79.4%, a difference of 0.020%), and Northern European (79.5%, a difference of 0.030%).
| Demographics | Rating | Rank | In Labor Force | Age 20-64 |
| Immigrants | Hungary | 36.8 /100 | #183 | Fair 79.5% |
| Finns | 35.9 /100 | #184 | Fair 79.5% |
| Israelis | 34.7 /100 | #185 | Fair 79.5% |
| Northern Europeans | 34.5 /100 | #186 | Fair 79.5% |
| Assyrians/Chaldeans/Syriacs | 33.3 /100 | #187 | Fair 79.4% |
| Immigrants | Haiti | 32.1 /100 | #188 | Fair 79.4% |
| Immigrants | El Salvador | 30.9 /100 | #189 | Fair 79.4% |
| Immigrants | Syria | 30.8 /100 | #190 | Fair 79.4% |
| Swiss | 28.9 /100 | #191 | Fair 79.4% |
| Immigrants | Denmark | 26.9 /100 | #192 | Fair 79.4% |
| Indonesians | 26.1 /100 | #193 | Fair 79.4% |
| Immigrants | Thailand | 24.8 /100 | #194 | Fair 79.4% |
| Immigrants | Austria | 23.7 /100 | #195 | Fair 79.4% |
| Ecuadorians | 23.1 /100 | #196 | Fair 79.4% |
| Immigrants | Senegal | 22.5 /100 | #197 | Fair 79.4% |