Immigrants from Sweden vs Immigrants from Syria In Labor Force | Age 20-64
COMPARE
Immigrants from Sweden
Immigrants from Syria
In Labor Force | Age 20-64
In Labor Force | Age 20-64 Comparison
Immigrants from Sweden
Immigrants from Syria
79.8%
IN LABOR FORCE | AGE 20-64
79.7/ 100
METRIC RATING
143rd/ 347
METRIC RANK
79.4%
IN LABOR FORCE | AGE 20-64
30.8/ 100
METRIC RATING
190th/ 347
METRIC RANK
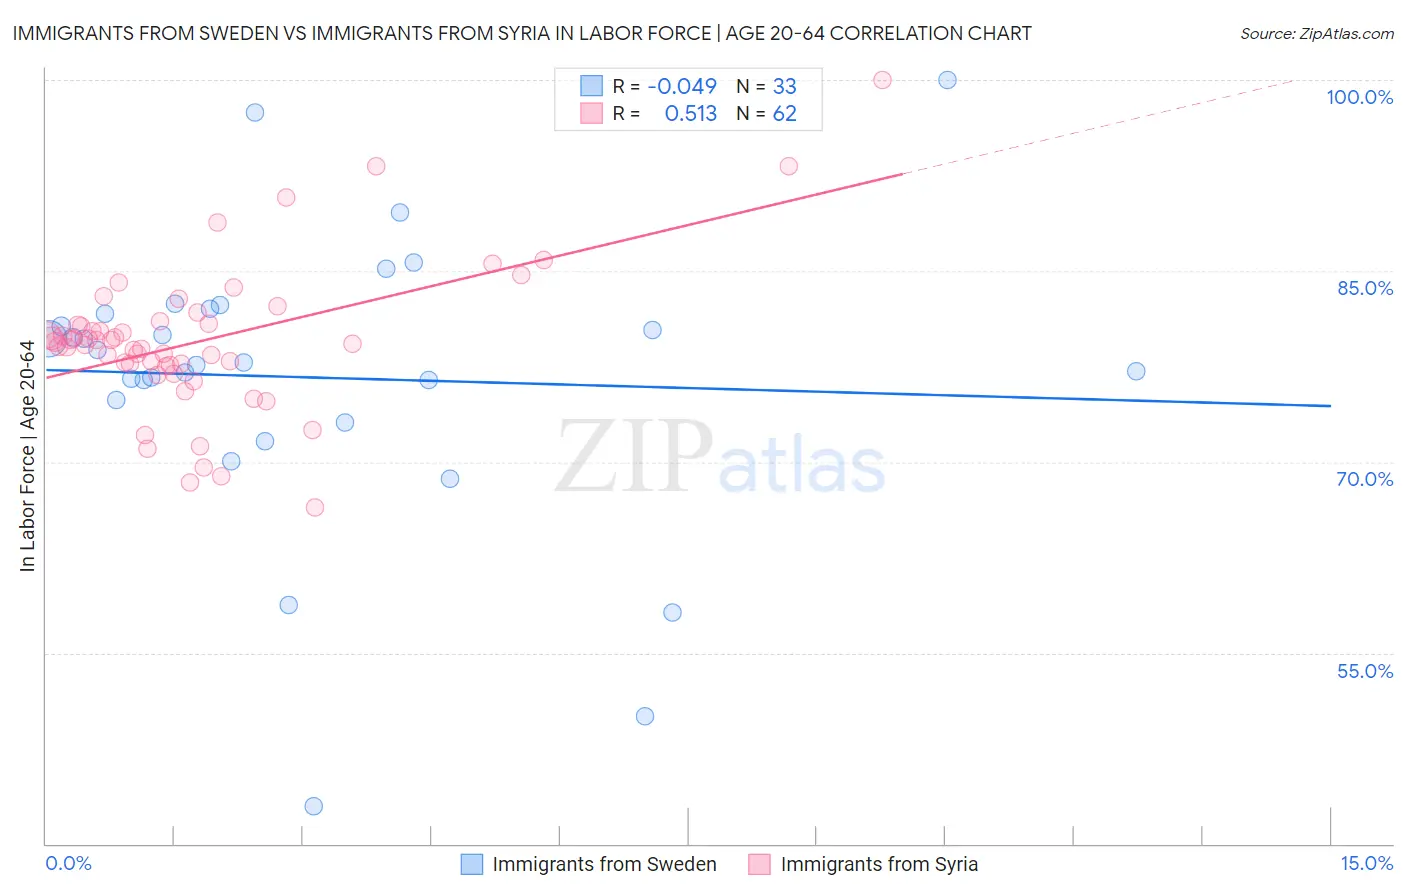
Immigrants from Sweden vs Immigrants from Syria In Labor Force | Age 20-64 Correlation Chart
The statistical analysis conducted on geographies consisting of 164,749,668 people shows no correlation between the proportion of Immigrants from Sweden and labor force participation rate among population between the ages 20 and 64 in the United States with a correlation coefficient (R) of -0.049 and weighted average of 79.8%. Similarly, the statistical analysis conducted on geographies consisting of 174,112,677 people shows a substantial positive correlation between the proportion of Immigrants from Syria and labor force participation rate among population between the ages 20 and 64 in the United States with a correlation coefficient (R) of 0.513 and weighted average of 79.4%, a difference of 0.44%.
In Labor Force | Age 20-64 Correlation Summary
| Measurement | Immigrants from Sweden | Immigrants from Syria |
| Minimum | 42.9% | 66.4% |
| Maximum | 100.0% | 100.0% |
| Range | 57.1% | 33.6% |
| Mean | 76.6% | 79.5% |
| Median | 77.8% | 79.4% |
| Interquartile 25% (IQ1) | 74.0% | 77.6% |
| Interquartile 75% (IQ3) | 81.8% | 80.9% |
| Interquartile Range (IQR) | 7.8% | 3.3% |
| Standard Deviation (Sample) | 11.4% | 5.8% |
| Standard Deviation (Population) | 11.2% | 5.8% |
Similar Demographics by In Labor Force | Age 20-64
Demographics Similar to Immigrants from Sweden by In Labor Force | Age 20-64
In terms of in labor force | age 20-64, the demographic groups most similar to Immigrants from Sweden are Immigrants from Israel (79.8%, a difference of 0.0%), Slovak (79.8%, a difference of 0.0%), Korean (79.8%, a difference of 0.0%), Immigrants from South Eastern Asia (79.8%, a difference of 0.010%), and Pakistani (79.8%, a difference of 0.010%).
| Demographics | Rating | Rank | In Labor Force | Age 20-64 |
| Immigrants | Singapore | 86.7 /100 | #136 | Excellent 79.9% |
| Immigrants | Ukraine | 86.5 /100 | #137 | Excellent 79.9% |
| Immigrants | Nigeria | 86.4 /100 | #138 | Excellent 79.9% |
| Immigrants | Spain | 83.9 /100 | #139 | Excellent 79.8% |
| Immigrants | South Eastern Asia | 80.4 /100 | #140 | Excellent 79.8% |
| Immigrants | Israel | 80.0 /100 | #141 | Good 79.8% |
| Slovaks | 79.9 /100 | #142 | Good 79.8% |
| Immigrants | Sweden | 79.7 /100 | #143 | Good 79.8% |
| Koreans | 79.6 /100 | #144 | Good 79.8% |
| Pakistanis | 79.3 /100 | #145 | Good 79.8% |
| Immigrants | Southern Europe | 78.9 /100 | #146 | Good 79.8% |
| Immigrants | Philippines | 78.0 /100 | #147 | Good 79.8% |
| Romanians | 77.6 /100 | #148 | Good 79.8% |
| Icelanders | 75.1 /100 | #149 | Good 79.7% |
| Costa Ricans | 72.4 /100 | #150 | Good 79.7% |
Demographics Similar to Immigrants from Syria by In Labor Force | Age 20-64
In terms of in labor force | age 20-64, the demographic groups most similar to Immigrants from Syria are Immigrants from El Salvador (79.4%, a difference of 0.0%), Immigrants from Haiti (79.4%, a difference of 0.010%), Assyrian/Chaldean/Syriac (79.4%, a difference of 0.020%), Swiss (79.4%, a difference of 0.020%), and Northern European (79.5%, a difference of 0.030%).
| Demographics | Rating | Rank | In Labor Force | Age 20-64 |
| Immigrants | Hungary | 36.8 /100 | #183 | Fair 79.5% |
| Finns | 35.9 /100 | #184 | Fair 79.5% |
| Israelis | 34.7 /100 | #185 | Fair 79.5% |
| Northern Europeans | 34.5 /100 | #186 | Fair 79.5% |
| Assyrians/Chaldeans/Syriacs | 33.3 /100 | #187 | Fair 79.4% |
| Immigrants | Haiti | 32.1 /100 | #188 | Fair 79.4% |
| Immigrants | El Salvador | 30.9 /100 | #189 | Fair 79.4% |
| Immigrants | Syria | 30.8 /100 | #190 | Fair 79.4% |
| Swiss | 28.9 /100 | #191 | Fair 79.4% |
| Immigrants | Denmark | 26.9 /100 | #192 | Fair 79.4% |
| Indonesians | 26.1 /100 | #193 | Fair 79.4% |
| Immigrants | Thailand | 24.8 /100 | #194 | Fair 79.4% |
| Immigrants | Austria | 23.7 /100 | #195 | Fair 79.4% |
| Ecuadorians | 23.1 /100 | #196 | Fair 79.4% |
| Immigrants | Senegal | 22.5 /100 | #197 | Fair 79.4% |