Kiowa vs Kenyan In Labor Force | Age 20-64
COMPARE
Kiowa
Kenyan
In Labor Force | Age 20-64
In Labor Force | Age 20-64 Comparison
Kiowa
Kenyans
75.0%
IN LABOR FORCE | AGE 20-64
0.0/ 100
METRIC RATING
328th/ 347
METRIC RANK
80.8%
IN LABOR FORCE | AGE 20-64
100.0/ 100
METRIC RATING
25th/ 347
METRIC RANK
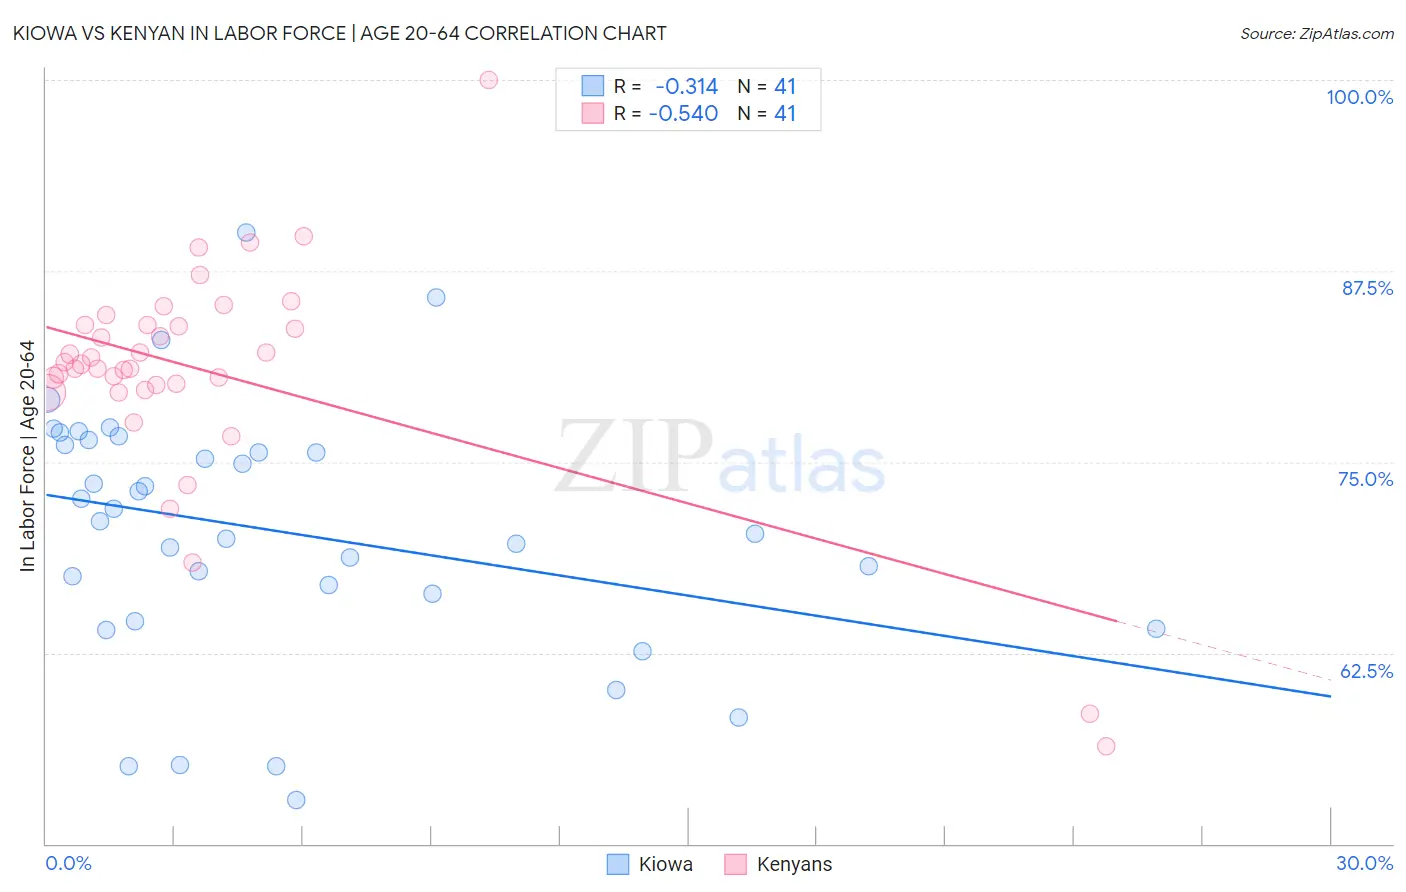
Kiowa vs Kenyan In Labor Force | Age 20-64 Correlation Chart
The statistical analysis conducted on geographies consisting of 56,099,396 people shows a mild negative correlation between the proportion of Kiowa and labor force participation rate among population between the ages 20 and 64 in the United States with a correlation coefficient (R) of -0.314 and weighted average of 75.0%. Similarly, the statistical analysis conducted on geographies consisting of 168,242,880 people shows a substantial negative correlation between the proportion of Kenyans and labor force participation rate among population between the ages 20 and 64 in the United States with a correlation coefficient (R) of -0.540 and weighted average of 80.8%, a difference of 7.8%.
In Labor Force | Age 20-64 Correlation Summary
| Measurement | Kiowa | Kenyan |
| Minimum | 52.9% | 56.4% |
| Maximum | 90.0% | 100.0% |
| Range | 37.1% | 43.6% |
| Mean | 70.5% | 80.9% |
| Median | 71.1% | 81.4% |
| Interquartile 25% (IQ1) | 65.5% | 79.8% |
| Interquartile 75% (IQ3) | 76.3% | 84.0% |
| Interquartile Range (IQR) | 10.8% | 4.1% |
| Standard Deviation (Sample) | 8.3% | 7.4% |
| Standard Deviation (Population) | 8.2% | 7.3% |
Similar Demographics by In Labor Force | Age 20-64
Demographics Similar to Kiowa by In Labor Force | Age 20-64
In terms of in labor force | age 20-64, the demographic groups most similar to Kiowa are Sioux (75.0%, a difference of 0.030%), Creek (75.1%, a difference of 0.20%), Cheyenne (74.8%, a difference of 0.20%), Colville (74.8%, a difference of 0.26%), and Paiute (74.7%, a difference of 0.40%).
| Demographics | Rating | Rank | In Labor Force | Age 20-64 |
| Seminole | 0.0 /100 | #321 | Tragic 75.5% |
| Dutch West Indians | 0.0 /100 | #322 | Tragic 75.5% |
| Cajuns | 0.0 /100 | #323 | Tragic 75.5% |
| Choctaw | 0.0 /100 | #324 | Tragic 75.4% |
| Menominee | 0.0 /100 | #325 | Tragic 75.3% |
| Creek | 0.0 /100 | #326 | Tragic 75.1% |
| Sioux | 0.0 /100 | #327 | Tragic 75.0% |
| Kiowa | 0.0 /100 | #328 | Tragic 75.0% |
| Cheyenne | 0.0 /100 | #329 | Tragic 74.8% |
| Colville | 0.0 /100 | #330 | Tragic 74.8% |
| Paiute | 0.0 /100 | #331 | Tragic 74.7% |
| Arapaho | 0.0 /100 | #332 | Tragic 74.4% |
| Natives/Alaskans | 0.0 /100 | #333 | Tragic 73.9% |
| Apache | 0.0 /100 | #334 | Tragic 73.7% |
| Ute | 0.0 /100 | #335 | Tragic 73.7% |
Demographics Similar to Kenyans by In Labor Force | Age 20-64
In terms of in labor force | age 20-64, the demographic groups most similar to Kenyans are Immigrants from Morocco (80.8%, a difference of 0.010%), Immigrants from Bosnia and Herzegovina (80.8%, a difference of 0.020%), Immigrants from Serbia (80.8%, a difference of 0.020%), Sudanese (80.8%, a difference of 0.030%), and Immigrants from Kenya (80.7%, a difference of 0.090%).
| Demographics | Rating | Rank | In Labor Force | Age 20-64 |
| Immigrants | Bulgaria | 100.0 /100 | #18 | Exceptional 81.0% |
| Zimbabweans | 100.0 /100 | #19 | Exceptional 81.0% |
| Thais | 100.0 /100 | #20 | Exceptional 80.9% |
| Liberians | 100.0 /100 | #21 | Exceptional 80.9% |
| Sudanese | 100.0 /100 | #22 | Exceptional 80.8% |
| Immigrants | Bosnia and Herzegovina | 100.0 /100 | #23 | Exceptional 80.8% |
| Immigrants | Morocco | 100.0 /100 | #24 | Exceptional 80.8% |
| Kenyans | 100.0 /100 | #25 | Exceptional 80.8% |
| Immigrants | Serbia | 100.0 /100 | #26 | Exceptional 80.8% |
| Immigrants | Kenya | 99.9 /100 | #27 | Exceptional 80.7% |
| Immigrants | Uganda | 99.9 /100 | #28 | Exceptional 80.7% |
| Immigrants | South Central Asia | 99.9 /100 | #29 | Exceptional 80.7% |
| Immigrants | North Macedonia | 99.9 /100 | #30 | Exceptional 80.7% |
| Immigrants | Lithuania | 99.9 /100 | #31 | Exceptional 80.7% |
| Immigrants | Ireland | 99.9 /100 | #32 | Exceptional 80.7% |