Immigrants from Croatia vs Kenyan In Labor Force | Age 20-64
COMPARE
Immigrants from Croatia
Kenyan
In Labor Force | Age 20-64
In Labor Force | Age 20-64 Comparison
Immigrants from Croatia
Kenyans
80.1%
IN LABOR FORCE | AGE 20-64
97.6/ 100
METRIC RATING
80th/ 347
METRIC RANK
80.8%
IN LABOR FORCE | AGE 20-64
100.0/ 100
METRIC RATING
25th/ 347
METRIC RANK
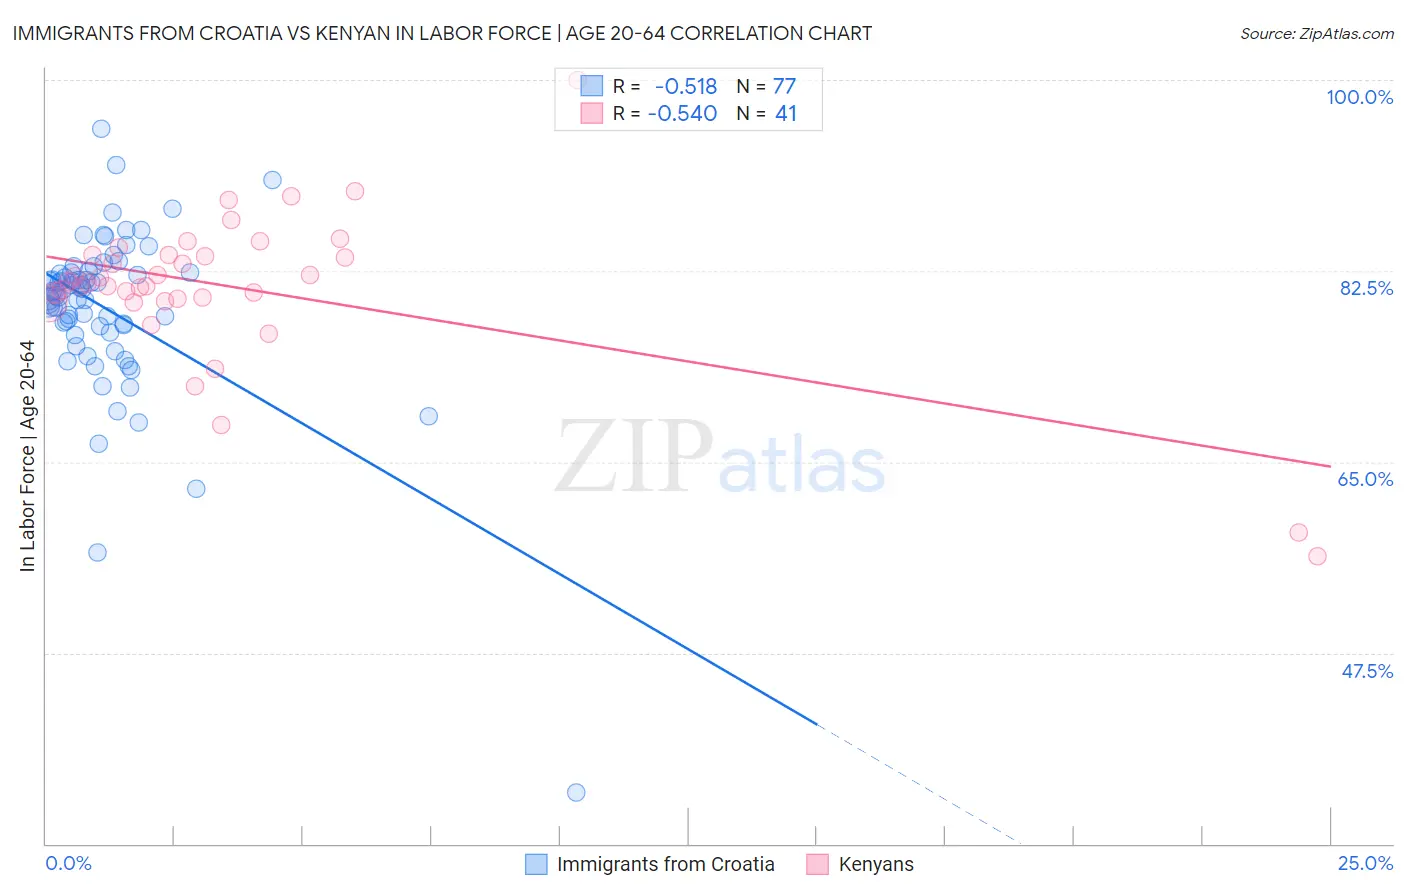
Immigrants from Croatia vs Kenyan In Labor Force | Age 20-64 Correlation Chart
The statistical analysis conducted on geographies consisting of 132,577,749 people shows a substantial negative correlation between the proportion of Immigrants from Croatia and labor force participation rate among population between the ages 20 and 64 in the United States with a correlation coefficient (R) of -0.518 and weighted average of 80.1%. Similarly, the statistical analysis conducted on geographies consisting of 168,242,880 people shows a substantial negative correlation between the proportion of Kenyans and labor force participation rate among population between the ages 20 and 64 in the United States with a correlation coefficient (R) of -0.540 and weighted average of 80.8%, a difference of 0.84%.
In Labor Force | Age 20-64 Correlation Summary
| Measurement | Immigrants from Croatia | Kenyan |
| Minimum | 34.7% | 56.4% |
| Maximum | 95.5% | 100.0% |
| Range | 60.8% | 43.6% |
| Mean | 79.0% | 80.9% |
| Median | 80.6% | 81.4% |
| Interquartile 25% (IQ1) | 77.2% | 79.8% |
| Interquartile 75% (IQ3) | 82.4% | 84.0% |
| Interquartile Range (IQR) | 5.2% | 4.1% |
| Standard Deviation (Sample) | 7.9% | 7.4% |
| Standard Deviation (Population) | 7.9% | 7.3% |
Similar Demographics by In Labor Force | Age 20-64
Demographics Similar to Immigrants from Croatia by In Labor Force | Age 20-64
In terms of in labor force | age 20-64, the demographic groups most similar to Immigrants from Croatia are Asian (80.2%, a difference of 0.010%), Egyptian (80.2%, a difference of 0.020%), Immigrants from Colombia (80.2%, a difference of 0.020%), Immigrants from Romania (80.2%, a difference of 0.020%), and German Russian (80.1%, a difference of 0.020%).
| Demographics | Rating | Rank | In Labor Force | Age 20-64 |
| Cypriots | 98.2 /100 | #73 | Exceptional 80.2% |
| Immigrants | Eastern Europe | 98.1 /100 | #74 | Exceptional 80.2% |
| Immigrants | Afghanistan | 97.9 /100 | #75 | Exceptional 80.2% |
| Egyptians | 97.8 /100 | #76 | Exceptional 80.2% |
| Immigrants | Colombia | 97.8 /100 | #77 | Exceptional 80.2% |
| Immigrants | Romania | 97.8 /100 | #78 | Exceptional 80.2% |
| Asians | 97.7 /100 | #79 | Exceptional 80.2% |
| Immigrants | Croatia | 97.6 /100 | #80 | Exceptional 80.1% |
| German Russians | 97.3 /100 | #81 | Exceptional 80.1% |
| Immigrants | Japan | 97.3 /100 | #82 | Exceptional 80.1% |
| Colombians | 97.3 /100 | #83 | Exceptional 80.1% |
| Immigrants | Latvia | 97.2 /100 | #84 | Exceptional 80.1% |
| Jordanians | 97.2 /100 | #85 | Exceptional 80.1% |
| Immigrants | Egypt | 97.1 /100 | #86 | Exceptional 80.1% |
| Croatians | 97.1 /100 | #87 | Exceptional 80.1% |
Demographics Similar to Kenyans by In Labor Force | Age 20-64
In terms of in labor force | age 20-64, the demographic groups most similar to Kenyans are Immigrants from Morocco (80.8%, a difference of 0.010%), Immigrants from Bosnia and Herzegovina (80.8%, a difference of 0.020%), Immigrants from Serbia (80.8%, a difference of 0.020%), Sudanese (80.8%, a difference of 0.030%), and Immigrants from Kenya (80.7%, a difference of 0.090%).
| Demographics | Rating | Rank | In Labor Force | Age 20-64 |
| Immigrants | Bulgaria | 100.0 /100 | #18 | Exceptional 81.0% |
| Zimbabweans | 100.0 /100 | #19 | Exceptional 81.0% |
| Thais | 100.0 /100 | #20 | Exceptional 80.9% |
| Liberians | 100.0 /100 | #21 | Exceptional 80.9% |
| Sudanese | 100.0 /100 | #22 | Exceptional 80.8% |
| Immigrants | Bosnia and Herzegovina | 100.0 /100 | #23 | Exceptional 80.8% |
| Immigrants | Morocco | 100.0 /100 | #24 | Exceptional 80.8% |
| Kenyans | 100.0 /100 | #25 | Exceptional 80.8% |
| Immigrants | Serbia | 100.0 /100 | #26 | Exceptional 80.8% |
| Immigrants | Kenya | 99.9 /100 | #27 | Exceptional 80.7% |
| Immigrants | Uganda | 99.9 /100 | #28 | Exceptional 80.7% |
| Immigrants | South Central Asia | 99.9 /100 | #29 | Exceptional 80.7% |
| Immigrants | North Macedonia | 99.9 /100 | #30 | Exceptional 80.7% |
| Immigrants | Lithuania | 99.9 /100 | #31 | Exceptional 80.7% |
| Immigrants | Ireland | 99.9 /100 | #32 | Exceptional 80.7% |