Kiowa vs Immigrants from Ghana In Labor Force | Age 20-64
COMPARE
Kiowa
Immigrants from Ghana
In Labor Force | Age 20-64
In Labor Force | Age 20-64 Comparison
Kiowa
Immigrants from Ghana
75.0%
IN LABOR FORCE | AGE 20-64
0.0/ 100
METRIC RATING
328th/ 347
METRIC RANK
80.0%
IN LABOR FORCE | AGE 20-64
95.0/ 100
METRIC RATING
105th/ 347
METRIC RANK
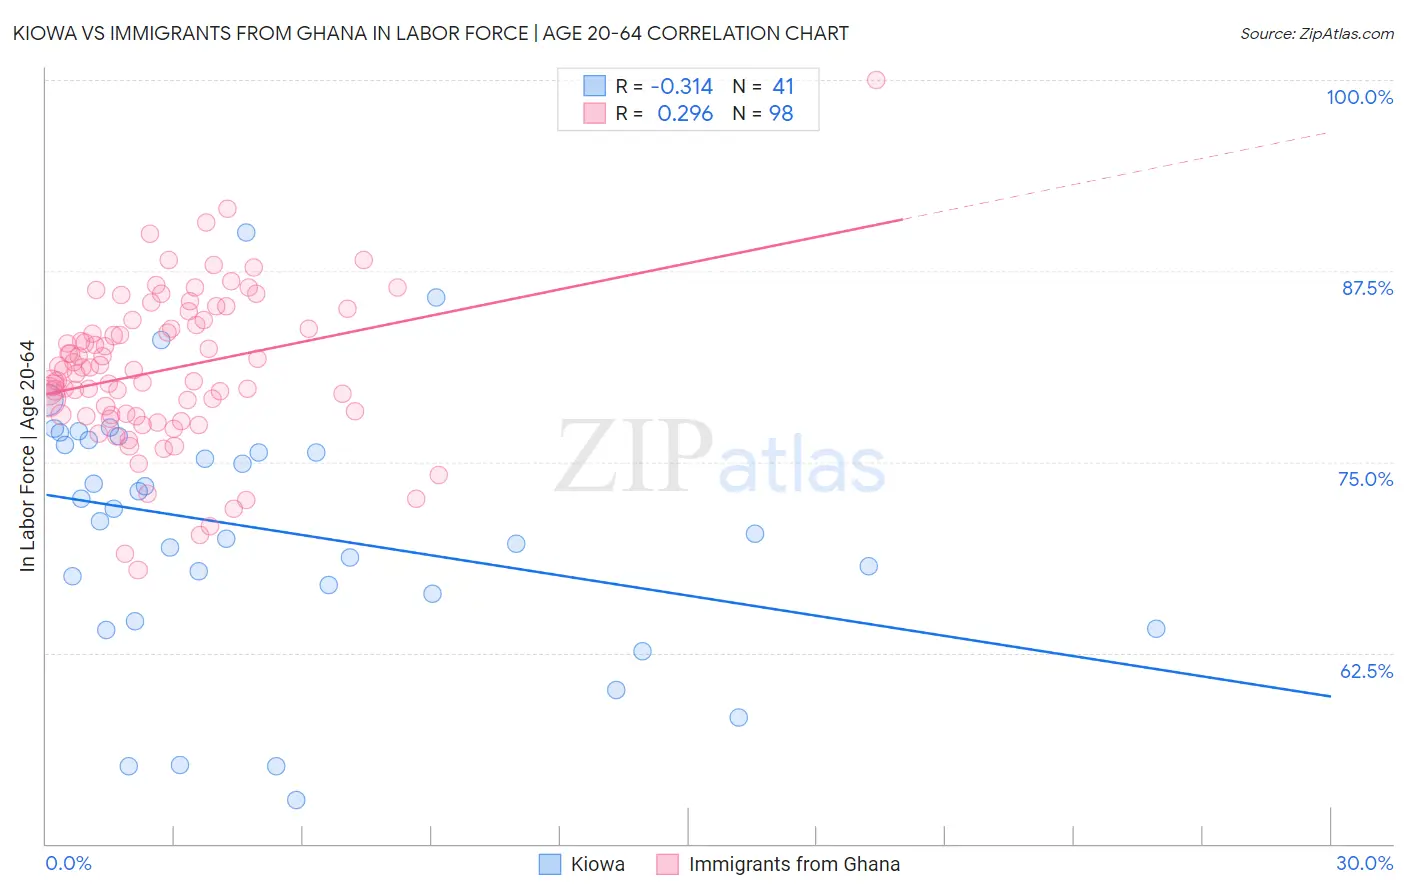
Kiowa vs Immigrants from Ghana In Labor Force | Age 20-64 Correlation Chart
The statistical analysis conducted on geographies consisting of 56,099,396 people shows a mild negative correlation between the proportion of Kiowa and labor force participation rate among population between the ages 20 and 64 in the United States with a correlation coefficient (R) of -0.314 and weighted average of 75.0%. Similarly, the statistical analysis conducted on geographies consisting of 199,964,545 people shows a weak positive correlation between the proportion of Immigrants from Ghana and labor force participation rate among population between the ages 20 and 64 in the United States with a correlation coefficient (R) of 0.296 and weighted average of 80.0%, a difference of 6.7%.
In Labor Force | Age 20-64 Correlation Summary
| Measurement | Kiowa | Immigrants from Ghana |
| Minimum | 52.9% | 67.9% |
| Maximum | 90.0% | 100.0% |
| Range | 37.1% | 32.1% |
| Mean | 70.5% | 81.1% |
| Median | 71.1% | 81.0% |
| Interquartile 25% (IQ1) | 65.5% | 78.0% |
| Interquartile 75% (IQ3) | 76.3% | 84.3% |
| Interquartile Range (IQR) | 10.8% | 6.3% |
| Standard Deviation (Sample) | 8.3% | 5.1% |
| Standard Deviation (Population) | 8.2% | 5.0% |
Similar Demographics by In Labor Force | Age 20-64
Demographics Similar to Kiowa by In Labor Force | Age 20-64
In terms of in labor force | age 20-64, the demographic groups most similar to Kiowa are Sioux (75.0%, a difference of 0.030%), Creek (75.1%, a difference of 0.20%), Cheyenne (74.8%, a difference of 0.20%), Colville (74.8%, a difference of 0.26%), and Paiute (74.7%, a difference of 0.40%).
| Demographics | Rating | Rank | In Labor Force | Age 20-64 |
| Seminole | 0.0 /100 | #321 | Tragic 75.5% |
| Dutch West Indians | 0.0 /100 | #322 | Tragic 75.5% |
| Cajuns | 0.0 /100 | #323 | Tragic 75.5% |
| Choctaw | 0.0 /100 | #324 | Tragic 75.4% |
| Menominee | 0.0 /100 | #325 | Tragic 75.3% |
| Creek | 0.0 /100 | #326 | Tragic 75.1% |
| Sioux | 0.0 /100 | #327 | Tragic 75.0% |
| Kiowa | 0.0 /100 | #328 | Tragic 75.0% |
| Cheyenne | 0.0 /100 | #329 | Tragic 74.8% |
| Colville | 0.0 /100 | #330 | Tragic 74.8% |
| Paiute | 0.0 /100 | #331 | Tragic 74.7% |
| Arapaho | 0.0 /100 | #332 | Tragic 74.4% |
| Natives/Alaskans | 0.0 /100 | #333 | Tragic 73.9% |
| Apache | 0.0 /100 | #334 | Tragic 73.7% |
| Ute | 0.0 /100 | #335 | Tragic 73.7% |
Demographics Similar to Immigrants from Ghana by In Labor Force | Age 20-64
In terms of in labor force | age 20-64, the demographic groups most similar to Immigrants from Ghana are Venezuelan (80.0%, a difference of 0.010%), Greek (80.0%, a difference of 0.010%), Immigrants from Jordan (80.0%, a difference of 0.010%), Palestinian (80.0%, a difference of 0.020%), and Immigrants from Australia (80.0%, a difference of 0.020%).
| Demographics | Rating | Rank | In Labor Force | Age 20-64 |
| Immigrants | Uruguay | 95.8 /100 | #98 | Exceptional 80.1% |
| Immigrants | Chile | 95.7 /100 | #99 | Exceptional 80.1% |
| Filipinos | 95.6 /100 | #100 | Exceptional 80.1% |
| Palestinians | 95.5 /100 | #101 | Exceptional 80.0% |
| Immigrants | Australia | 95.5 /100 | #102 | Exceptional 80.0% |
| Russians | 95.5 /100 | #103 | Exceptional 80.0% |
| Venezuelans | 95.3 /100 | #104 | Exceptional 80.0% |
| Immigrants | Ghana | 95.0 /100 | #105 | Exceptional 80.0% |
| Greeks | 94.8 /100 | #106 | Exceptional 80.0% |
| Immigrants | Jordan | 94.8 /100 | #107 | Exceptional 80.0% |
| Iranians | 94.3 /100 | #108 | Exceptional 80.0% |
| Immigrants | Argentina | 94.1 /100 | #109 | Exceptional 80.0% |
| Estonians | 94.0 /100 | #110 | Exceptional 80.0% |
| Immigrants | South America | 93.9 /100 | #111 | Exceptional 80.0% |
| Immigrants | Italy | 93.9 /100 | #112 | Exceptional 80.0% |