Icelander vs Kenyan In Labor Force | Age 20-64
COMPARE
Icelander
Kenyan
In Labor Force | Age 20-64
In Labor Force | Age 20-64 Comparison
Icelanders
Kenyans
79.7%
IN LABOR FORCE | AGE 20-64
75.1/ 100
METRIC RATING
149th/ 347
METRIC RANK
80.8%
IN LABOR FORCE | AGE 20-64
100.0/ 100
METRIC RATING
25th/ 347
METRIC RANK
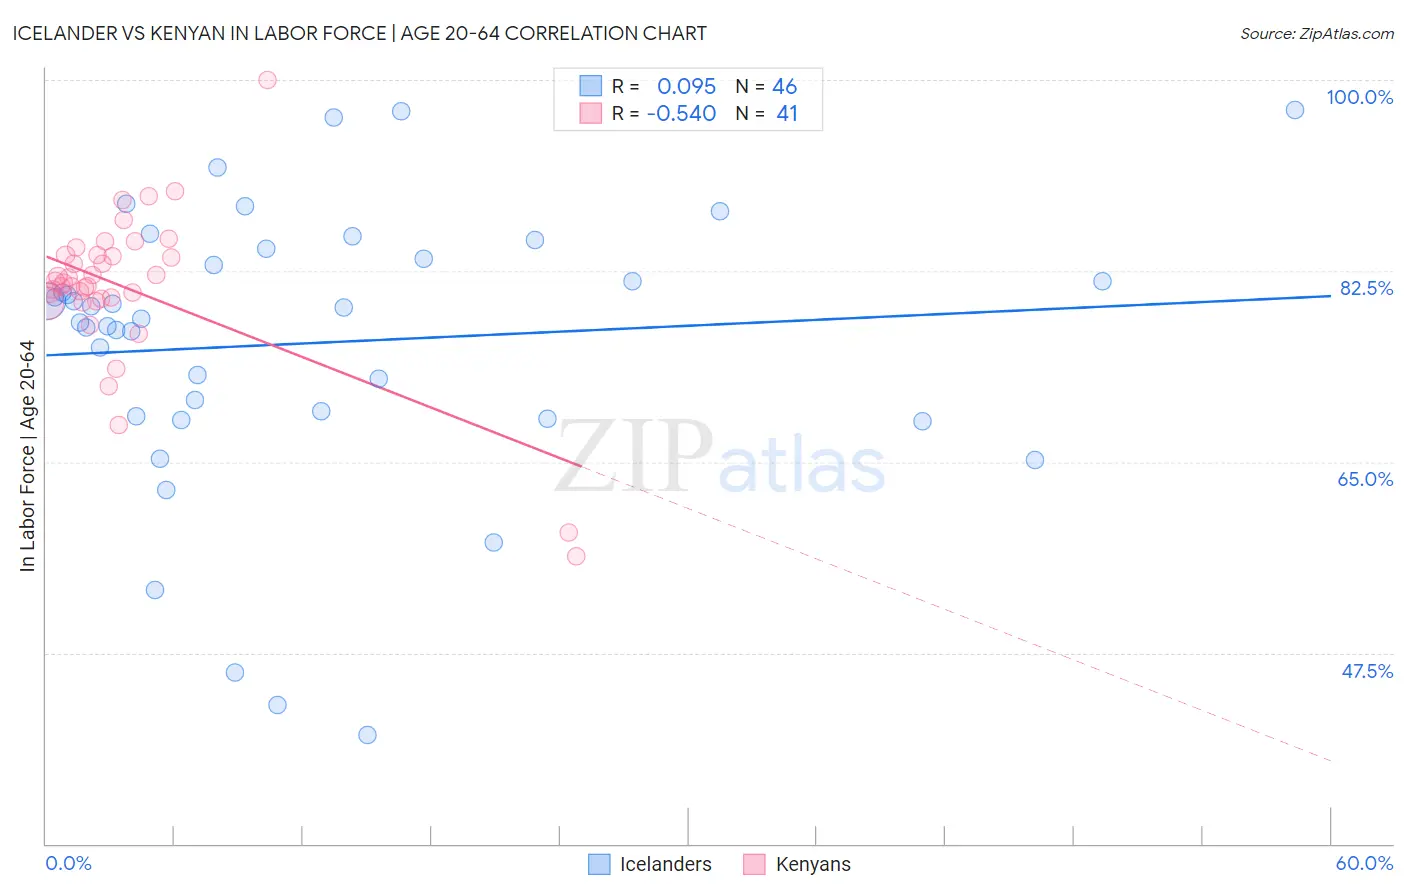
Icelander vs Kenyan In Labor Force | Age 20-64 Correlation Chart
The statistical analysis conducted on geographies consisting of 159,668,592 people shows a slight positive correlation between the proportion of Icelanders and labor force participation rate among population between the ages 20 and 64 in the United States with a correlation coefficient (R) of 0.095 and weighted average of 79.7%. Similarly, the statistical analysis conducted on geographies consisting of 168,242,880 people shows a substantial negative correlation between the proportion of Kenyans and labor force participation rate among population between the ages 20 and 64 in the United States with a correlation coefficient (R) of -0.540 and weighted average of 80.8%, a difference of 1.4%.
In Labor Force | Age 20-64 Correlation Summary
| Measurement | Icelander | Kenyan |
| Minimum | 40.0% | 56.4% |
| Maximum | 97.2% | 100.0% |
| Range | 57.2% | 43.6% |
| Mean | 75.9% | 80.9% |
| Median | 78.6% | 81.4% |
| Interquartile 25% (IQ1) | 69.2% | 79.8% |
| Interquartile 75% (IQ3) | 83.6% | 84.0% |
| Interquartile Range (IQR) | 14.4% | 4.1% |
| Standard Deviation (Sample) | 13.0% | 7.4% |
| Standard Deviation (Population) | 12.8% | 7.3% |
Similar Demographics by In Labor Force | Age 20-64
Demographics Similar to Icelanders by In Labor Force | Age 20-64
In terms of in labor force | age 20-64, the demographic groups most similar to Icelanders are Immigrants from Philippines (79.8%, a difference of 0.030%), Romanian (79.8%, a difference of 0.030%), Costa Rican (79.7%, a difference of 0.030%), Scandinavian (79.7%, a difference of 0.030%), and Immigrants from Northern Europe (79.7%, a difference of 0.030%).
| Demographics | Rating | Rank | In Labor Force | Age 20-64 |
| Slovaks | 79.9 /100 | #142 | Good 79.8% |
| Immigrants | Sweden | 79.7 /100 | #143 | Good 79.8% |
| Koreans | 79.6 /100 | #144 | Good 79.8% |
| Pakistanis | 79.3 /100 | #145 | Good 79.8% |
| Immigrants | Southern Europe | 78.9 /100 | #146 | Good 79.8% |
| Immigrants | Philippines | 78.0 /100 | #147 | Good 79.8% |
| Romanians | 77.6 /100 | #148 | Good 79.8% |
| Icelanders | 75.1 /100 | #149 | Good 79.7% |
| Costa Ricans | 72.4 /100 | #150 | Good 79.7% |
| Scandinavians | 72.0 /100 | #151 | Good 79.7% |
| Immigrants | Northern Europe | 72.0 /100 | #152 | Good 79.7% |
| Immigrants | Kazakhstan | 69.5 /100 | #153 | Good 79.7% |
| New Zealanders | 69.4 /100 | #154 | Good 79.7% |
| Immigrants | South Africa | 69.2 /100 | #155 | Good 79.7% |
| Senegalese | 69.1 /100 | #156 | Good 79.7% |
Demographics Similar to Kenyans by In Labor Force | Age 20-64
In terms of in labor force | age 20-64, the demographic groups most similar to Kenyans are Immigrants from Morocco (80.8%, a difference of 0.010%), Immigrants from Bosnia and Herzegovina (80.8%, a difference of 0.020%), Immigrants from Serbia (80.8%, a difference of 0.020%), Sudanese (80.8%, a difference of 0.030%), and Immigrants from Kenya (80.7%, a difference of 0.090%).
| Demographics | Rating | Rank | In Labor Force | Age 20-64 |
| Immigrants | Bulgaria | 100.0 /100 | #18 | Exceptional 81.0% |
| Zimbabweans | 100.0 /100 | #19 | Exceptional 81.0% |
| Thais | 100.0 /100 | #20 | Exceptional 80.9% |
| Liberians | 100.0 /100 | #21 | Exceptional 80.9% |
| Sudanese | 100.0 /100 | #22 | Exceptional 80.8% |
| Immigrants | Bosnia and Herzegovina | 100.0 /100 | #23 | Exceptional 80.8% |
| Immigrants | Morocco | 100.0 /100 | #24 | Exceptional 80.8% |
| Kenyans | 100.0 /100 | #25 | Exceptional 80.8% |
| Immigrants | Serbia | 100.0 /100 | #26 | Exceptional 80.8% |
| Immigrants | Kenya | 99.9 /100 | #27 | Exceptional 80.7% |
| Immigrants | Uganda | 99.9 /100 | #28 | Exceptional 80.7% |
| Immigrants | South Central Asia | 99.9 /100 | #29 | Exceptional 80.7% |
| Immigrants | North Macedonia | 99.9 /100 | #30 | Exceptional 80.7% |
| Immigrants | Lithuania | 99.9 /100 | #31 | Exceptional 80.7% |
| Immigrants | Ireland | 99.9 /100 | #32 | Exceptional 80.7% |