Kiowa vs Iroquois In Labor Force | Age 20-64
COMPARE
Kiowa
Iroquois
In Labor Force | Age 20-64
In Labor Force | Age 20-64 Comparison
Kiowa
Iroquois
75.0%
IN LABOR FORCE | AGE 20-64
0.0/ 100
METRIC RATING
328th/ 347
METRIC RANK
77.5%
IN LABOR FORCE | AGE 20-64
0.0/ 100
METRIC RATING
302nd/ 347
METRIC RANK
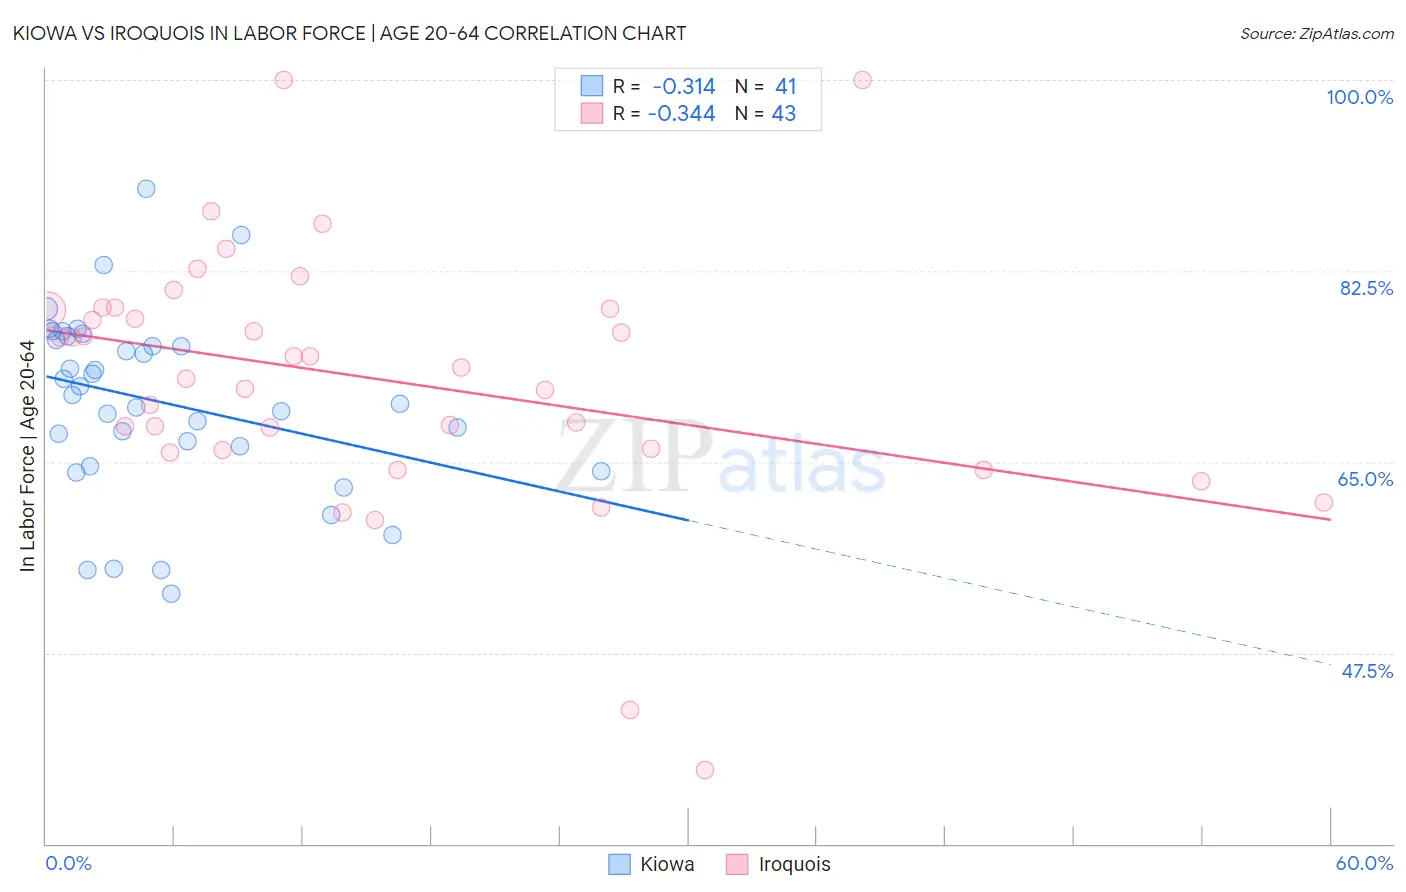
Kiowa vs Iroquois In Labor Force | Age 20-64 Correlation Chart
The statistical analysis conducted on geographies consisting of 56,099,396 people shows a mild negative correlation between the proportion of Kiowa and labor force participation rate among population between the ages 20 and 64 in the United States with a correlation coefficient (R) of -0.314 and weighted average of 75.0%. Similarly, the statistical analysis conducted on geographies consisting of 207,293,239 people shows a mild negative correlation between the proportion of Iroquois and labor force participation rate among population between the ages 20 and 64 in the United States with a correlation coefficient (R) of -0.344 and weighted average of 77.5%, a difference of 3.3%.
In Labor Force | Age 20-64 Correlation Summary
| Measurement | Kiowa | Iroquois |
| Minimum | 52.9% | 36.8% |
| Maximum | 90.0% | 100.0% |
| Range | 37.1% | 63.2% |
| Mean | 70.5% | 72.6% |
| Median | 71.1% | 73.7% |
| Interquartile 25% (IQ1) | 65.5% | 66.1% |
| Interquartile 75% (IQ3) | 76.3% | 79.0% |
| Interquartile Range (IQR) | 10.8% | 12.9% |
| Standard Deviation (Sample) | 8.3% | 11.8% |
| Standard Deviation (Population) | 8.2% | 11.7% |
Similar Demographics by In Labor Force | Age 20-64
Demographics Similar to Kiowa by In Labor Force | Age 20-64
In terms of in labor force | age 20-64, the demographic groups most similar to Kiowa are Sioux (75.0%, a difference of 0.030%), Creek (75.1%, a difference of 0.20%), Cheyenne (74.8%, a difference of 0.20%), Colville (74.8%, a difference of 0.26%), and Paiute (74.7%, a difference of 0.40%).
| Demographics | Rating | Rank | In Labor Force | Age 20-64 |
| Seminole | 0.0 /100 | #321 | Tragic 75.5% |
| Dutch West Indians | 0.0 /100 | #322 | Tragic 75.5% |
| Cajuns | 0.0 /100 | #323 | Tragic 75.5% |
| Choctaw | 0.0 /100 | #324 | Tragic 75.4% |
| Menominee | 0.0 /100 | #325 | Tragic 75.3% |
| Creek | 0.0 /100 | #326 | Tragic 75.1% |
| Sioux | 0.0 /100 | #327 | Tragic 75.0% |
| Kiowa | 0.0 /100 | #328 | Tragic 75.0% |
| Cheyenne | 0.0 /100 | #329 | Tragic 74.8% |
| Colville | 0.0 /100 | #330 | Tragic 74.8% |
| Paiute | 0.0 /100 | #331 | Tragic 74.7% |
| Arapaho | 0.0 /100 | #332 | Tragic 74.4% |
| Natives/Alaskans | 0.0 /100 | #333 | Tragic 73.9% |
| Apache | 0.0 /100 | #334 | Tragic 73.7% |
| Ute | 0.0 /100 | #335 | Tragic 73.7% |
Demographics Similar to Iroquois by In Labor Force | Age 20-64
In terms of in labor force | age 20-64, the demographic groups most similar to Iroquois are Nepalese (77.5%, a difference of 0.050%), Spanish American Indian (77.6%, a difference of 0.090%), Hispanic or Latino (77.6%, a difference of 0.16%), Dominican (77.7%, a difference of 0.22%), and Cree (77.7%, a difference of 0.22%).
| Demographics | Rating | Rank | In Labor Force | Age 20-64 |
| Immigrants | Grenada | 0.0 /100 | #295 | Tragic 77.7% |
| Immigrants | Dominican Republic | 0.0 /100 | #296 | Tragic 77.7% |
| Dominicans | 0.0 /100 | #297 | Tragic 77.7% |
| Cree | 0.0 /100 | #298 | Tragic 77.7% |
| Hispanics or Latinos | 0.0 /100 | #299 | Tragic 77.6% |
| Spanish American Indians | 0.0 /100 | #300 | Tragic 77.6% |
| Nepalese | 0.0 /100 | #301 | Tragic 77.5% |
| Iroquois | 0.0 /100 | #302 | Tragic 77.5% |
| Chippewa | 0.0 /100 | #303 | Tragic 77.3% |
| Immigrants | Mexico | 0.0 /100 | #304 | Tragic 77.3% |
| Mexicans | 0.0 /100 | #305 | Tragic 77.2% |
| Potawatomi | 0.0 /100 | #306 | Tragic 77.2% |
| Central American Indians | 0.0 /100 | #307 | Tragic 77.1% |
| Alaska Natives | 0.0 /100 | #308 | Tragic 77.0% |
| Americans | 0.0 /100 | #309 | Tragic 77.0% |