Kenyan vs Serbian In Labor Force | Age 35-44
COMPARE
Kenyan
Serbian
In Labor Force | Age 35-44
In Labor Force | Age 35-44 Comparison
Kenyans
Serbians
85.2%
IN LABOR FORCE | AGE 35-44
99.8/ 100
METRIC RATING
37th/ 347
METRIC RANK
85.1%
IN LABOR FORCE | AGE 35-44
99.4/ 100
METRIC RATING
59th/ 347
METRIC RANK
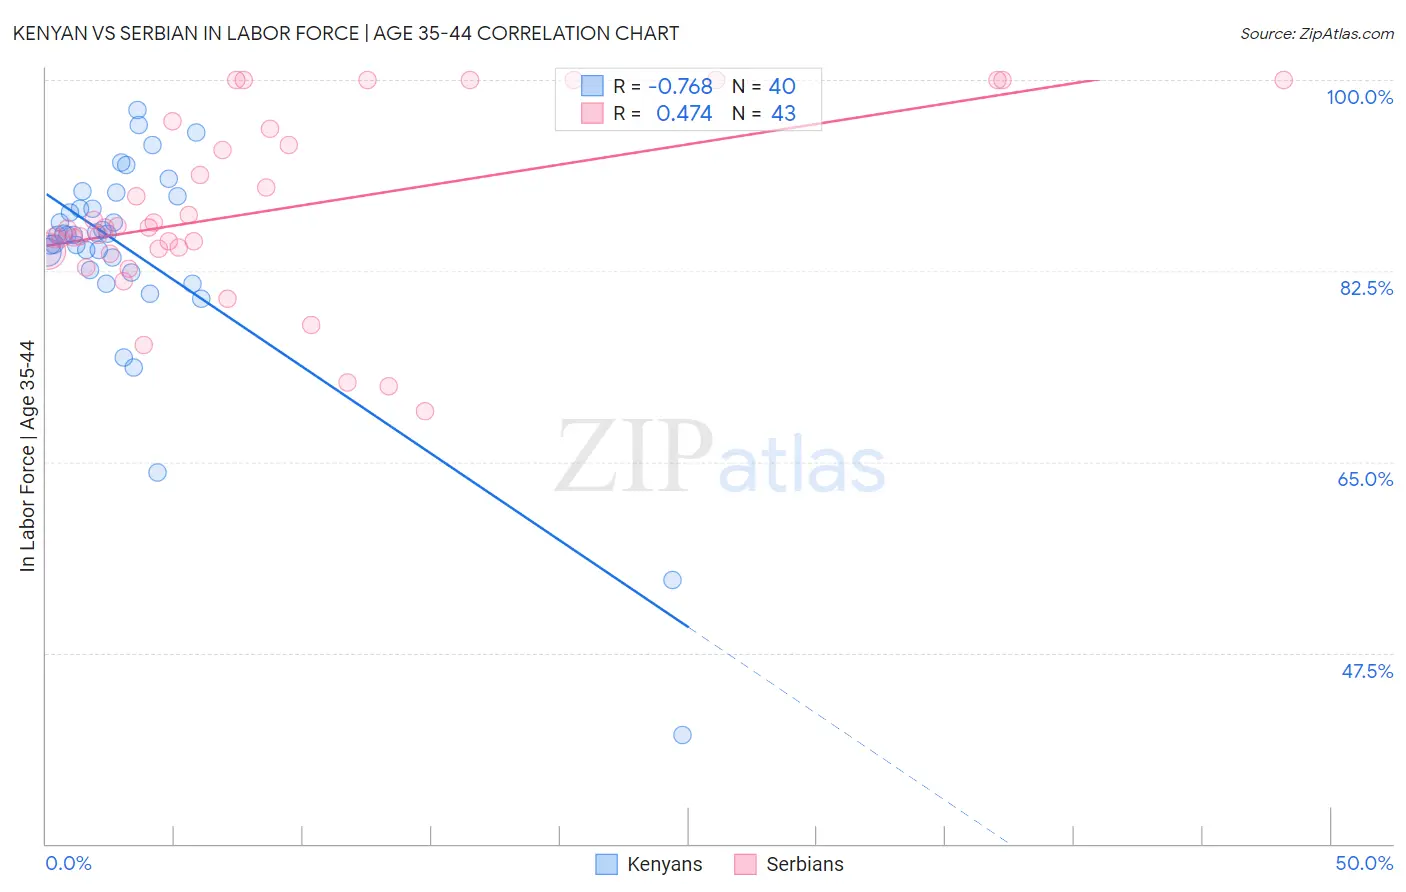
Kenyan vs Serbian In Labor Force | Age 35-44 Correlation Chart
The statistical analysis conducted on geographies consisting of 168,197,384 people shows a strong negative correlation between the proportion of Kenyans and labor force participation rate among population between the ages 35 and 44 in the United States with a correlation coefficient (R) of -0.768 and weighted average of 85.2%. Similarly, the statistical analysis conducted on geographies consisting of 267,549,100 people shows a moderate positive correlation between the proportion of Serbians and labor force participation rate among population between the ages 35 and 44 in the United States with a correlation coefficient (R) of 0.474 and weighted average of 85.1%, a difference of 0.20%.
In Labor Force | Age 35-44 Correlation Summary
| Measurement | Kenyan | Serbian |
| Minimum | 40.0% | 69.6% |
| Maximum | 97.2% | 100.0% |
| Range | 57.2% | 30.4% |
| Mean | 83.8% | 88.1% |
| Median | 85.8% | 86.4% |
| Interquartile 25% (IQ1) | 82.5% | 84.3% |
| Interquartile 75% (IQ3) | 88.8% | 95.5% |
| Interquartile Range (IQR) | 6.3% | 11.2% |
| Standard Deviation (Sample) | 10.6% | 8.3% |
| Standard Deviation (Population) | 10.5% | 8.2% |
Similar Demographics by In Labor Force | Age 35-44
Demographics Similar to Kenyans by In Labor Force | Age 35-44
In terms of in labor force | age 35-44, the demographic groups most similar to Kenyans are Immigrants from Morocco (85.2%, a difference of 0.010%), Immigrants from Poland (85.2%, a difference of 0.010%), Eastern European (85.2%, a difference of 0.010%), Immigrants from Bulgaria (85.2%, a difference of 0.020%), and Immigrants from Zimbabwe (85.2%, a difference of 0.020%).
| Demographics | Rating | Rank | In Labor Force | Age 35-44 |
| Bermudans | 99.9 /100 | #30 | Exceptional 85.3% |
| Czechs | 99.9 /100 | #31 | Exceptional 85.3% |
| Immigrants | India | 99.9 /100 | #32 | Exceptional 85.3% |
| Ugandans | 99.9 /100 | #33 | Exceptional 85.3% |
| Immigrants | Nepal | 99.9 /100 | #34 | Exceptional 85.3% |
| Estonians | 99.9 /100 | #35 | Exceptional 85.3% |
| Immigrants | Morocco | 99.8 /100 | #36 | Exceptional 85.2% |
| Kenyans | 99.8 /100 | #37 | Exceptional 85.2% |
| Immigrants | Poland | 99.8 /100 | #38 | Exceptional 85.2% |
| Eastern Europeans | 99.8 /100 | #39 | Exceptional 85.2% |
| Immigrants | Bulgaria | 99.8 /100 | #40 | Exceptional 85.2% |
| Immigrants | Zimbabwe | 99.8 /100 | #41 | Exceptional 85.2% |
| Macedonians | 99.8 /100 | #42 | Exceptional 85.2% |
| Poles | 99.8 /100 | #43 | Exceptional 85.2% |
| Lithuanians | 99.8 /100 | #44 | Exceptional 85.2% |
Demographics Similar to Serbians by In Labor Force | Age 35-44
In terms of in labor force | age 35-44, the demographic groups most similar to Serbians are Slovak (85.1%, a difference of 0.0%), Albanian (85.1%, a difference of 0.0%), Chinese (85.1%, a difference of 0.010%), Immigrants from Croatia (85.1%, a difference of 0.020%), and Immigrants from Latvia (85.0%, a difference of 0.020%).
| Demographics | Rating | Rank | In Labor Force | Age 35-44 |
| Immigrants | Kenya | 99.6 /100 | #52 | Exceptional 85.1% |
| Taiwanese | 99.6 /100 | #53 | Exceptional 85.1% |
| Turks | 99.5 /100 | #54 | Exceptional 85.1% |
| Soviet Union | 99.5 /100 | #55 | Exceptional 85.1% |
| Immigrants | Croatia | 99.5 /100 | #56 | Exceptional 85.1% |
| Chinese | 99.4 /100 | #57 | Exceptional 85.1% |
| Slovaks | 99.4 /100 | #58 | Exceptional 85.1% |
| Serbians | 99.4 /100 | #59 | Exceptional 85.1% |
| Albanians | 99.4 /100 | #60 | Exceptional 85.1% |
| Immigrants | Latvia | 99.3 /100 | #61 | Exceptional 85.0% |
| Immigrants | Moldova | 99.3 /100 | #62 | Exceptional 85.0% |
| Immigrants | Uganda | 99.3 /100 | #63 | Exceptional 85.0% |
| Swedes | 99.2 /100 | #64 | Exceptional 85.0% |
| Immigrants | Brazil | 99.2 /100 | #65 | Exceptional 85.0% |
| Immigrants | Haiti | 99.1 /100 | #66 | Exceptional 85.0% |