Kenyan vs Austrian In Labor Force | Age 35-44

COMPARE

Kenyan
Race
Ancestry
AfghanAfricanAlaska NativeAlaskan AthabascanAlbanianAleutAlsatianAmericanApacheArabArapahoArgentineanArmenianAssyrian/Chaldean/SyriacAustralianBahamianBangladeshiBarbadianBasqueBelgianBelizeanBermudanBhutaneseBlackfeetBolivianBrazilianBritishBritish West IndianBulgarianBurmeseCajunCambodianCanadianCape VerdeanCarpatho RusynCelticCentral AmericanCentral American IndianCherokeeCheyenneChickasawChileanChineseChippewaChoctawColombianColvilleComancheCosta RicanCreeCreekCroatianCrowCubanCypriotCzechCzechoslovakianDanishDelawareDominicanDutchDutch West IndianEastern EuropeanEcuadorianEgyptianEnglishEstonianEthiopianEuropeanFijianFilipinoFinnishFrenchFrench American IndianFrench CanadianGermanGerman RussianGhanaianGreekGuamanian/ChamorroGuatemalanGuyaneseHaitianHmongHonduranHopiHoumaHungarianIcelanderIndian (Asian)IndonesianInupiatIranianIraqiIrishIroquoisIsraeliItalianJamaicanJapaneseJordanianKenyanKiowaKoreanLaotianLatvianLebaneseLiberianLithuanianLumbeeLuxembourgerMacedonianMalaysianMalteseMarshalleseMenomineeMexicanMexican American IndianMongolianMoroccanNative HawaiianNavajoNepaleseNew ZealanderNicaraguanNigerianNorthern EuropeanNorwegianOkinawanOsageOttawaPaiutePakistaniPalestinianPanamanianParaguayanPennsylvania GermanPeruvianPimaPolishPortuguesePotawatomiPuebloPuerto RicanPuget Sound SalishRomanianRussianSalvadoranSamoanScandinavianScotch-IrishScottishSeminoleSenegaleseSerbianShoshoneSierra LeoneanSiouxSlavicSlovakSloveneSomaliSouth AfricanSouth AmericanSouth American IndianSoviet UnionSpaniardSpanishSpanish AmericanSpanish American IndianSri LankanSubsaharan AfricanSudaneseSwedishSwissSyrianTaiwaneseThaiTlingit-HaidaTohono O'OdhamTonganTrinidadian and TobagonianTsimshianTurkishU.S. Virgin IslanderUgandanUkrainianUruguayanUteVenezuelanVietnameseWelshWest IndianYakamaYaquiYugoslavianYumanYup'ikZimbabwean
Immigration
NonimmigrantsImmigrantsAfghanistanAfricaAlbaniaArgentinaArmeniaAsiaAustraliaAustriaBahamasBangladeshBarbadosBelarusBelgiumBelizeBoliviaBosnia and HerzegovinaBrazilBulgariaBurma/MyanmarCabo VerdeCambodiaCameroonCanadaCaribbeanCentral AmericaChileChinaColombiaCongoCosta RicaCroatiaCubaCzechoslovakiaDenmarkDominicaDominican RepublicEastern AfricaEastern AsiaEastern EuropeEcuadorEgyptEl SalvadorEnglandEritreaEthiopiaEuropeFijiFranceGermanyGhanaGreeceGrenadaGuatemalaGuyanaHaitiHondurasHong KongHungaryIndiaIndonesiaIranIraqIrelandIsraelItalyJamaicaJapanJordanKazakhstanKenyaKoreaKuwaitLaosLatin AmericaLatviaLebanonLiberiaLithuaniaMalaysiaMexicoMicronesiaMiddle AfricaMoldovaMoroccoNepalNetherlandsNicaraguaNigeriaNorth AmericaNorth MacedoniaNorthern AfricaNorthern EuropeNorwayOceaniaPakistanPanamaPeruPhilippinesPolandPortugalRomaniaRussiaSaudi ArabiaScotlandSenegalSerbiaSierra LeoneSingaporeSomaliaSouth AfricaSouth AmericaSouth Central AsiaSouth Eastern AsiaSouthern EuropeSpainSri LankaSt. Vincent and the GrenadinesSudanSwedenSwitzerlandSyriaTaiwanThailandTrinidad and TobagoTurkeyUgandaUkraineUruguayUzbekistanVenezuelaVietnamWest IndiesWestern AfricaWestern AsiaWestern EuropeYemenZaireZimbabweAzores
Austrian
Race
Ancestry
AfghanAfricanAlaska NativeAlaskan AthabascanAlbanianAleutAlsatianAmericanApacheArabArapahoArgentineanArmenianAssyrian/Chaldean/SyriacAustralianAustrianBahamianBangladeshiBarbadianBasqueBelgianBelizeanBermudanBhutaneseBlackfeetBolivianBrazilianBritishBritish West IndianBulgarianBurmeseCajunCambodianCanadianCape VerdeanCarpatho RusynCelticCentral AmericanCentral American IndianCherokeeCheyenneChickasawChileanChineseChippewaChoctawColombianColvilleComancheCosta RicanCreeCreekCroatianCrowCubanCypriotCzechCzechoslovakianDanishDelawareDominicanDutchDutch West IndianEastern EuropeanEcuadorianEgyptianEnglishEstonianEthiopianEuropeanFijianFilipinoFinnishFrenchFrench American IndianFrench CanadianGermanGerman RussianGhanaianGreekGuamanian/ChamorroGuatemalanGuyaneseHaitianHmongHonduranHopiHoumaHungarianIcelanderIndian (Asian)IndonesianInupiatIranianIraqiIrishIroquoisIsraeliItalianJamaicanJapaneseJordanianKiowaKoreanLaotianLatvianLebaneseLiberianLithuanianLumbeeLuxembourgerMacedonianMalaysianMalteseMarshalleseMenomineeMexicanMexican American IndianMongolianMoroccanNative HawaiianNavajoNepaleseNew ZealanderNicaraguanNigerianNorthern EuropeanNorwegianOkinawanOsageOttawaPaiutePakistaniPalestinianPanamanianParaguayanPennsylvania GermanPeruvianPimaPolishPortuguesePotawatomiPuebloPuerto RicanPuget Sound SalishRomanianRussianSalvadoranSamoanScandinavianScotch-IrishScottishSeminoleSenegaleseSerbianShoshoneSierra LeoneanSiouxSlavicSlovakSloveneSomaliSouth AfricanSouth AmericanSouth American IndianSoviet UnionSpaniardSpanishSpanish AmericanSpanish American IndianSri LankanSubsaharan AfricanSudaneseSwedishSwissSyrianTaiwaneseThaiTlingit-HaidaTohono O'OdhamTonganTrinidadian and TobagonianTsimshianTurkishU.S. Virgin IslanderUgandanUkrainianUruguayanUteVenezuelanVietnameseWelshWest IndianYakamaYaquiYugoslavianYumanYup'ikZimbabwean
Immigration
NonimmigrantsImmigrantsAfghanistanAfricaAlbaniaArgentinaArmeniaAsiaAustraliaAustriaBahamasBangladeshBarbadosBelarusBelgiumBelizeBoliviaBosnia and HerzegovinaBrazilBulgariaBurma/MyanmarCabo VerdeCambodiaCameroonCanadaCaribbeanCentral AmericaChileChinaColombiaCongoCosta RicaCroatiaCubaCzechoslovakiaDenmarkDominicaDominican RepublicEastern AfricaEastern AsiaEastern EuropeEcuadorEgyptEl SalvadorEnglandEritreaEthiopiaEuropeFijiFranceGermanyGhanaGreeceGrenadaGuatemalaGuyanaHaitiHondurasHong KongHungaryIndiaIndonesiaIranIraqIrelandIsraelItalyJamaicaJapanJordanKazakhstanKenyaKoreaKuwaitLaosLatin AmericaLatviaLebanonLiberiaLithuaniaMalaysiaMexicoMicronesiaMiddle AfricaMoldovaMoroccoNepalNetherlandsNicaraguaNigeriaNorth AmericaNorth MacedoniaNorthern AfricaNorthern EuropeNorwayOceaniaPakistanPanamaPeruPhilippinesPolandPortugalRomaniaRussiaSaudi ArabiaScotlandSenegalSerbiaSierra LeoneSingaporeSomaliaSouth AfricaSouth AmericaSouth Central AsiaSouth Eastern AsiaSouthern EuropeSpainSri LankaSt. Vincent and the GrenadinesSudanSwedenSwitzerlandSyriaTaiwanThailandTrinidad and TobagoTurkeyUgandaUkraineUruguayUzbekistanVenezuelaVietnamWest IndiesWestern AfricaWestern AsiaWestern EuropeYemenZaireZimbabweAzores
In Labor Force | Age 35-44
Income
Poverty
Unemployment
Labor Participation
Family Structure
Vehicle Availability
Education Level
Disability

In Labor Force | Age 35-44 Comparison

Kenyans

Austrians

Exceptional
Excellent
85.2%
IN LABOR FORCE | AGE 35-44
99.8/ 100
METRIC RATING
37th/ 347
METRIC RANK
84.7%
IN LABOR FORCE | AGE 35-44
89.4/ 100
METRIC RATING
132nd/ 347
METRIC RANK

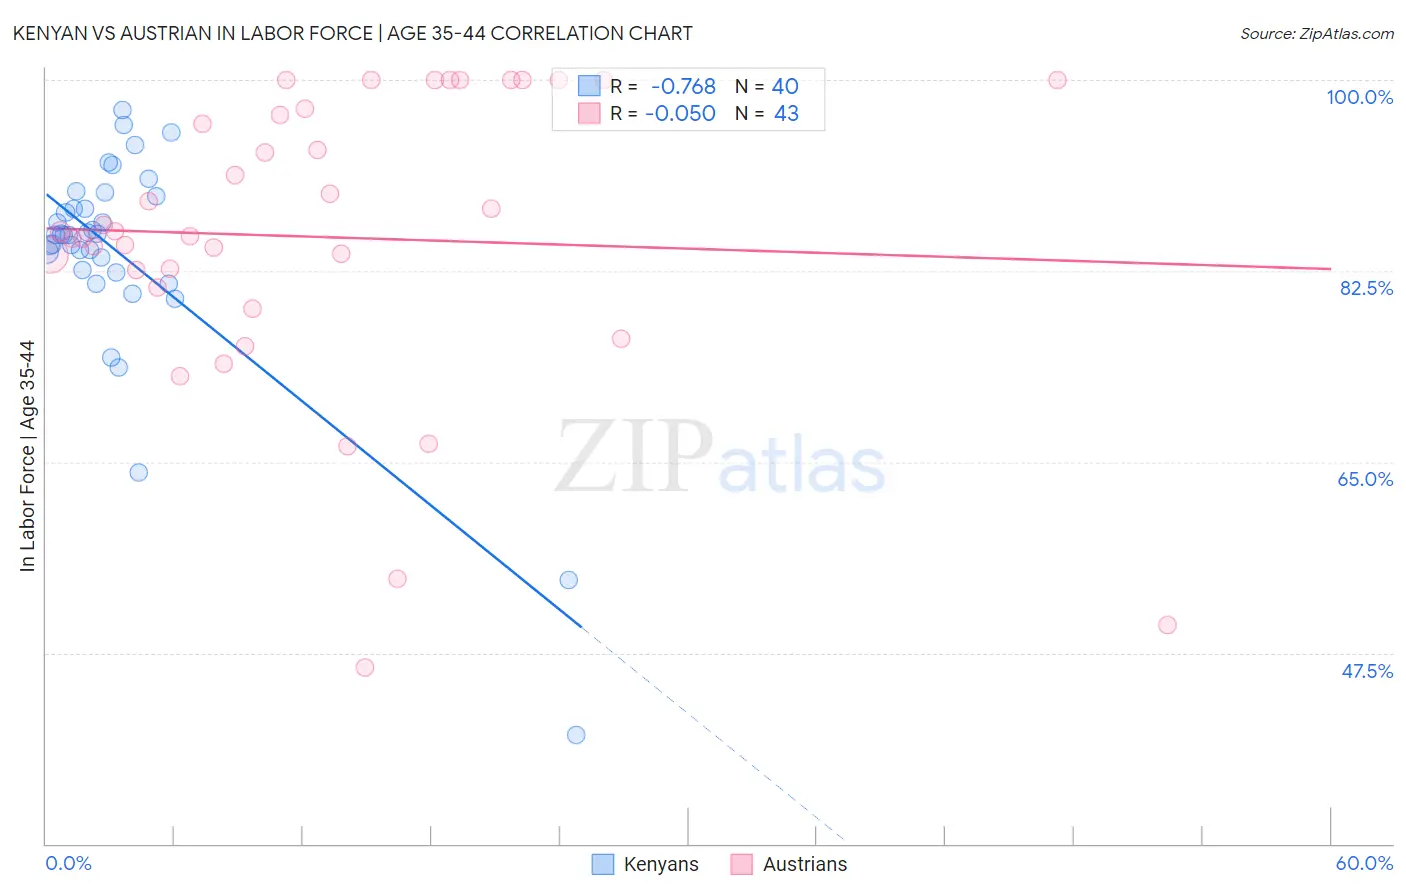
Kenyan vs Austrian In Labor Force | Age 35-44 Correlation Chart

The statistical analysis conducted on geographies consisting of 168,197,384 people shows a strong negative correlation between the proportion of Kenyans and labor force participation rate among population between the ages 35 and 44 in the United States with a correlation coefficient (R) of -0.768 and weighted average of 85.2%. Similarly, the statistical analysis conducted on geographies consisting of 451,816,853 people shows a slight negative correlation between the proportion of Austrians and labor force participation rate among population between the ages 35 and 44 in the United States with a correlation coefficient (R) of -0.050 and weighted average of 84.7%, a difference of 0.68%.
Kenyan vs Austrian In Labor Force | Age 35-44

In Labor Force | Age 35-44 Correlation Summary

MeasurementKenyanAustrian
Minimum40.0%46.2%
Maximum97.2%100.0%
Range57.2%53.8%
Mean83.8%85.6%
Median85.8%86.1%
Interquartile 25% (IQ1)82.5%81.0%
Interquartile 75% (IQ3)88.8%97.4%
Interquartile Range (IQR)6.3%16.4%
Standard Deviation (Sample)10.6%13.6%
Standard Deviation (Population)10.5%13.4%

Similar Demographics by In Labor Force | Age 35-44

Demographics Similar to Kenyans by In Labor Force | Age 35-44

In terms of in labor force | age 35-44, the demographic groups most similar to Kenyans are Immigrants from Morocco (85.2%, a difference of 0.010%), Immigrants from Poland (85.2%, a difference of 0.010%), Eastern European (85.2%, a difference of 0.010%), Immigrants from Bulgaria (85.2%, a difference of 0.020%), and Immigrants from Zimbabwe (85.2%, a difference of 0.020%).
DemographicsRating | RankIn Labor Force | Age 35-44
Bermudans
99.9
/100
|
#30
Exceptional
85.3%
Czechs
99.9
/100
|
#31
Exceptional
85.3%
Immigrants | India
99.9
/100
|
#32
Exceptional
85.3%
Ugandans
99.9
/100
|
#33
Exceptional
85.3%
Immigrants | Nepal
99.9
/100
|
#34
Exceptional
85.3%
Estonians
99.9
/100
|
#35
Exceptional
85.3%
Immigrants | Morocco
99.8
/100
|
#36
Exceptional
85.2%
Kenyans
99.8
/100
|
#37
Exceptional
85.2%
Immigrants | Poland
99.8
/100
|
#38
Exceptional
85.2%
Eastern Europeans
99.8
/100
|
#39
Exceptional
85.2%
Immigrants | Bulgaria
99.8
/100
|
#40
Exceptional
85.2%
Immigrants | Zimbabwe
99.8
/100
|
#41
Exceptional
85.2%
Macedonians
99.8
/100
|
#42
Exceptional
85.2%
Poles
99.8
/100
|
#43
Exceptional
85.2%
Lithuanians
99.8
/100
|
#44
Exceptional
85.2%

Demographics Similar to Austrians by In Labor Force | Age 35-44

In terms of in labor force | age 35-44, the demographic groups most similar to Austrians are Palestinian (84.7%, a difference of 0.0%), Bhutanese (84.7%, a difference of 0.0%), Immigrants from Scotland (84.7%, a difference of 0.0%), Maltese (84.7%, a difference of 0.020%), and Asian (84.7%, a difference of 0.020%).
DemographicsRating | RankIn Labor Force | Age 35-44
Maltese
90.8
/100
|
#125
Exceptional
84.7%
Asians
90.6
/100
|
#126
Exceptional
84.7%
Immigrants | Spain
90.6
/100
|
#127
Exceptional
84.7%
Immigrants | Ghana
90.4
/100
|
#128
Exceptional
84.7%
Palestinians
89.7
/100
|
#129
Excellent
84.7%
Bhutanese
89.7
/100
|
#130
Excellent
84.7%
Immigrants | Scotland
89.6
/100
|
#131
Excellent
84.7%
Austrians
89.4
/100
|
#132
Excellent
84.7%
Argentineans
88.4
/100
|
#133
Excellent
84.6%
Immigrants | Korea
88.2
/100
|
#134
Excellent
84.6%
Immigrants | Malaysia
87.5
/100
|
#135
Excellent
84.6%
Afghans
86.3
/100
|
#136
Excellent
84.6%
Immigrants | Chile
84.6
/100
|
#137
Excellent
84.6%
Czechoslovakians
82.6
/100
|
#138
Excellent
84.6%
Immigrants | Zaire
82.5
/100
|
#139
Excellent
84.6%