Kenyan vs Immigrants from Grenada In Labor Force | Age 25-29
COMPARE
Kenyan
Immigrants from Grenada
In Labor Force | Age 25-29
In Labor Force | Age 25-29 Comparison
Kenyans
Immigrants from Grenada
85.4%
IN LABOR FORCE | AGE 25-29
99.0/ 100
METRIC RATING
71st/ 347
METRIC RANK
82.8%
IN LABOR FORCE | AGE 25-29
0.0/ 100
METRIC RATING
303rd/ 347
METRIC RANK
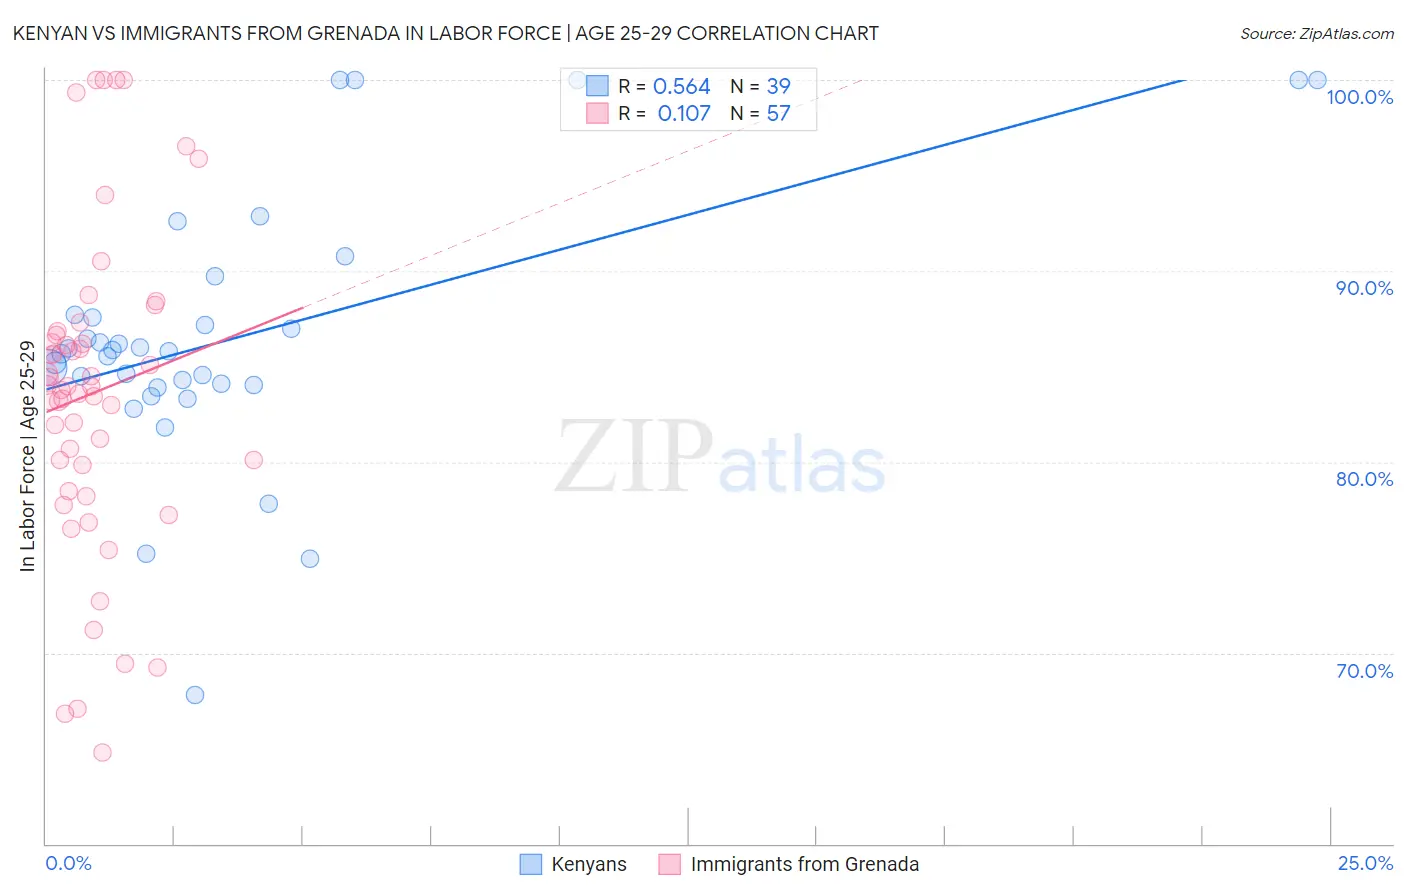
Kenyan vs Immigrants from Grenada In Labor Force | Age 25-29 Correlation Chart
The statistical analysis conducted on geographies consisting of 168,218,619 people shows a substantial positive correlation between the proportion of Kenyans and labor force participation rate among population between the ages 25 and 29 in the United States with a correlation coefficient (R) of 0.564 and weighted average of 85.4%. Similarly, the statistical analysis conducted on geographies consisting of 67,199,109 people shows a poor positive correlation between the proportion of Immigrants from Grenada and labor force participation rate among population between the ages 25 and 29 in the United States with a correlation coefficient (R) of 0.107 and weighted average of 82.8%, a difference of 3.1%.
In Labor Force | Age 25-29 Correlation Summary
| Measurement | Kenyan | Immigrants from Grenada |
| Minimum | 67.8% | 64.8% |
| Maximum | 100.0% | 100.0% |
| Range | 32.2% | 35.2% |
| Mean | 86.6% | 83.6% |
| Median | 85.8% | 84.0% |
| Interquartile 25% (IQ1) | 84.1% | 79.2% |
| Interquartile 75% (IQ3) | 87.7% | 86.7% |
| Interquartile Range (IQR) | 3.6% | 7.6% |
| Standard Deviation (Sample) | 6.9% | 8.3% |
| Standard Deviation (Population) | 6.8% | 8.3% |
Similar Demographics by In Labor Force | Age 25-29
Demographics Similar to Kenyans by In Labor Force | Age 25-29
In terms of in labor force | age 25-29, the demographic groups most similar to Kenyans are Menominee (85.4%, a difference of 0.020%), Immigrants from Sweden (85.4%, a difference of 0.020%), Immigrants from Australia (85.3%, a difference of 0.020%), Russian (85.3%, a difference of 0.030%), and Immigrants from Turkey (85.4%, a difference of 0.040%).
| Demographics | Rating | Rank | In Labor Force | Age 25-29 |
| Immigrants | Italy | 99.3 /100 | #64 | Exceptional 85.4% |
| Immigrants | Czechoslovakia | 99.3 /100 | #65 | Exceptional 85.4% |
| Immigrants | Scotland | 99.3 /100 | #66 | Exceptional 85.4% |
| Immigrants | Turkey | 99.2 /100 | #67 | Exceptional 85.4% |
| Immigrants | Cameroon | 99.2 /100 | #68 | Exceptional 85.4% |
| Menominee | 99.1 /100 | #69 | Exceptional 85.4% |
| Immigrants | Sweden | 99.1 /100 | #70 | Exceptional 85.4% |
| Kenyans | 99.0 /100 | #71 | Exceptional 85.4% |
| Immigrants | Australia | 98.9 /100 | #72 | Exceptional 85.3% |
| Russians | 98.8 /100 | #73 | Exceptional 85.3% |
| Soviet Union | 98.5 /100 | #74 | Exceptional 85.3% |
| Brazilians | 98.3 /100 | #75 | Exceptional 85.3% |
| Germans | 98.1 /100 | #76 | Exceptional 85.3% |
| Immigrants | South Central Asia | 97.9 /100 | #77 | Exceptional 85.2% |
| Immigrants | Egypt | 97.7 /100 | #78 | Exceptional 85.2% |
Demographics Similar to Immigrants from Grenada by In Labor Force | Age 25-29
In terms of in labor force | age 25-29, the demographic groups most similar to Immigrants from Grenada are Immigrants from Belize (82.8%, a difference of 0.010%), Vietnamese (82.8%, a difference of 0.050%), Spanish American Indian (82.9%, a difference of 0.11%), Fijian (82.9%, a difference of 0.12%), and Immigrants from St. Vincent and the Grenadines (82.7%, a difference of 0.12%).
| Demographics | Rating | Rank | In Labor Force | Age 25-29 |
| Immigrants | Nicaragua | 0.0 /100 | #296 | Tragic 82.9% |
| Potawatomi | 0.0 /100 | #297 | Tragic 82.9% |
| Native Hawaiians | 0.0 /100 | #298 | Tragic 82.9% |
| Fijians | 0.0 /100 | #299 | Tragic 82.9% |
| Spanish American Indians | 0.0 /100 | #300 | Tragic 82.9% |
| Vietnamese | 0.0 /100 | #301 | Tragic 82.8% |
| Immigrants | Belize | 0.0 /100 | #302 | Tragic 82.8% |
| Immigrants | Grenada | 0.0 /100 | #303 | Tragic 82.8% |
| Immigrants | St. Vincent and the Grenadines | 0.0 /100 | #304 | Tragic 82.7% |
| Blacks/African Americans | 0.0 /100 | #305 | Tragic 82.6% |
| Blackfeet | 0.0 /100 | #306 | Tragic 82.6% |
| Cajuns | 0.0 /100 | #307 | Tragic 82.5% |
| Central American Indians | 0.0 /100 | #308 | Tragic 82.4% |
| Immigrants | Central America | 0.0 /100 | #309 | Tragic 82.4% |
| Osage | 0.0 /100 | #310 | Tragic 82.3% |