Kenyan vs Immigrants from Grenada 1st Grade
COMPARE
Kenyan
Immigrants from Grenada
1st Grade
1st Grade Comparison
Kenyans
Immigrants from Grenada
97.9%
1ST GRADE
51.2/ 100
METRIC RATING
173rd/ 347
METRIC RANK
97.2%
1ST GRADE
0.0/ 100
METRIC RATING
294th/ 347
METRIC RANK
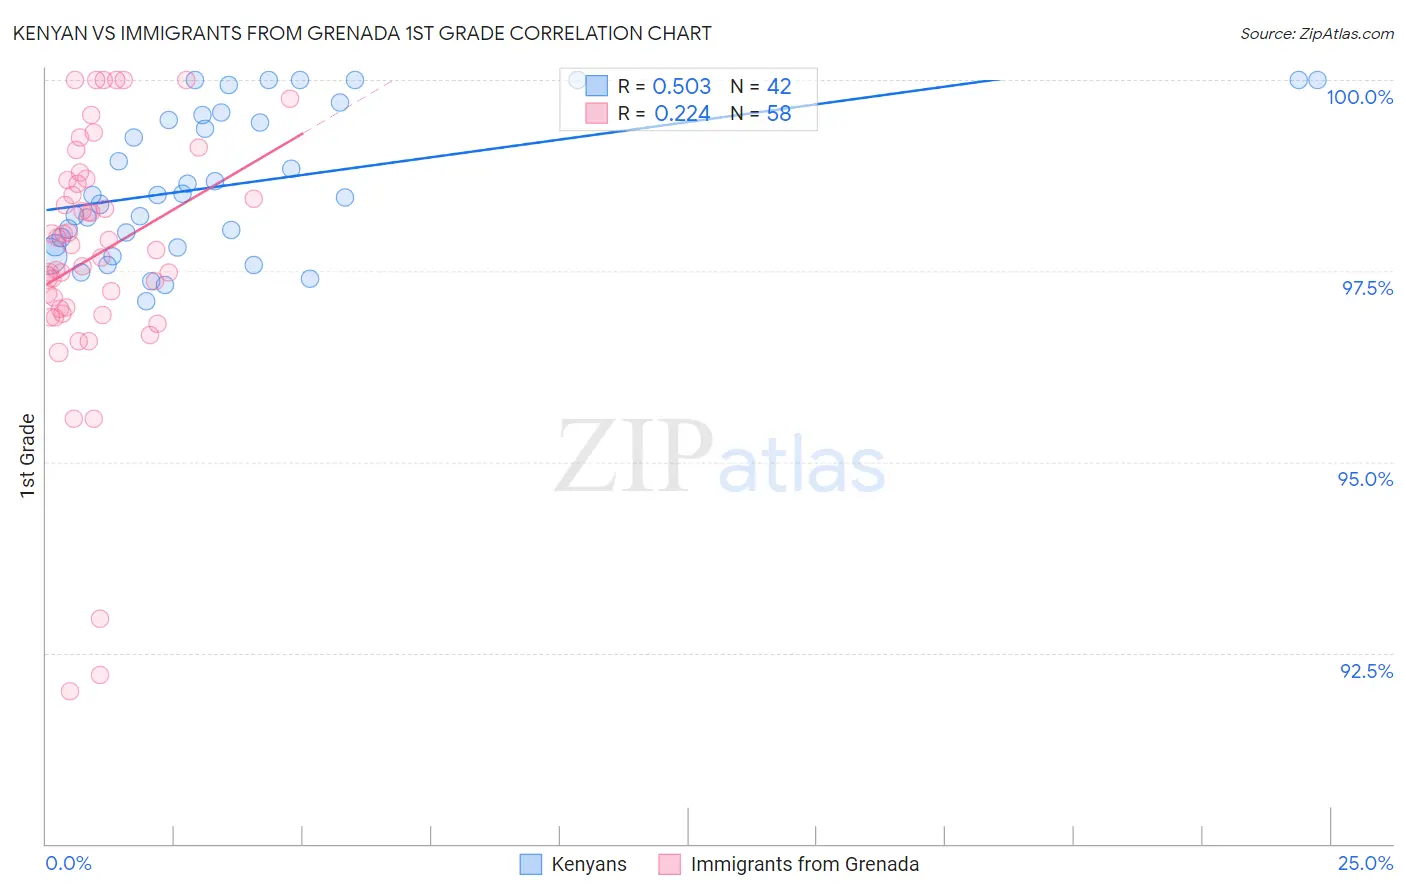
Kenyan vs Immigrants from Grenada 1st Grade Correlation Chart
The statistical analysis conducted on geographies consisting of 168,244,481 people shows a substantial positive correlation between the proportion of Kenyans and percentage of population with at least 1st grade education in the United States with a correlation coefficient (R) of 0.503 and weighted average of 97.9%. Similarly, the statistical analysis conducted on geographies consisting of 67,200,336 people shows a weak positive correlation between the proportion of Immigrants from Grenada and percentage of population with at least 1st grade education in the United States with a correlation coefficient (R) of 0.224 and weighted average of 97.2%, a difference of 0.77%.
1st Grade Correlation Summary
| Measurement | Kenyan | Immigrants from Grenada |
| Minimum | 97.1% | 92.0% |
| Maximum | 100.0% | 100.0% |
| Range | 2.9% | 8.0% |
| Mean | 98.6% | 97.7% |
| Median | 98.5% | 97.8% |
| Interquartile 25% (IQ1) | 97.8% | 97.0% |
| Interquartile 75% (IQ3) | 99.5% | 98.7% |
| Interquartile Range (IQR) | 1.7% | 1.7% |
| Standard Deviation (Sample) | 0.94% | 1.7% |
| Standard Deviation (Population) | 0.93% | 1.7% |
Similar Demographics by 1st Grade
Demographics Similar to Kenyans by 1st Grade
In terms of 1st grade, the demographic groups most similar to Kenyans are Native/Alaskan (97.9%, a difference of 0.0%), Immigrants from Sri Lanka (97.9%, a difference of 0.0%), Albanian (97.9%, a difference of 0.0%), Chilean (97.9%, a difference of 0.010%), and Immigrants from Micronesia (97.9%, a difference of 0.010%).
| Demographics | Rating | Rank | 1st Grade |
| Navajo | 56.6 /100 | #166 | Average 97.9% |
| Bermudans | 56.3 /100 | #167 | Average 97.9% |
| Chileans | 55.6 /100 | #168 | Average 97.9% |
| Immigrants | Micronesia | 55.3 /100 | #169 | Average 97.9% |
| Immigrants | Spain | 54.9 /100 | #170 | Average 97.9% |
| Immigrants | Jordan | 53.9 /100 | #171 | Average 97.9% |
| Immigrants | Korea | 53.0 /100 | #172 | Average 97.9% |
| Kenyans | 51.2 /100 | #173 | Average 97.9% |
| Natives/Alaskans | 50.0 /100 | #174 | Average 97.9% |
| Immigrants | Sri Lanka | 49.7 /100 | #175 | Average 97.9% |
| Albanians | 49.6 /100 | #176 | Average 97.9% |
| Immigrants | Brazil | 49.1 /100 | #177 | Average 97.9% |
| Immigrants | Venezuela | 47.8 /100 | #178 | Average 97.9% |
| Argentineans | 47.2 /100 | #179 | Average 97.9% |
| Immigrants | Bosnia and Herzegovina | 46.6 /100 | #180 | Average 97.9% |
Demographics Similar to Immigrants from Grenada by 1st Grade
In terms of 1st grade, the demographic groups most similar to Immigrants from Grenada are Immigrants (97.2%, a difference of 0.010%), Immigrants from Eritrea (97.2%, a difference of 0.010%), Malaysian (97.2%, a difference of 0.020%), British West Indian (97.2%, a difference of 0.040%), and Houma (97.2%, a difference of 0.060%).
| Demographics | Rating | Rank | 1st Grade |
| Immigrants | Hong Kong | 0.0 /100 | #287 | Tragic 97.3% |
| Immigrants | Thailand | 0.0 /100 | #288 | Tragic 97.3% |
| Immigrants | Afghanistan | 0.0 /100 | #289 | Tragic 97.3% |
| Immigrants | St. Vincent and the Grenadines | 0.0 /100 | #290 | Tragic 97.3% |
| Houma | 0.0 /100 | #291 | Tragic 97.2% |
| British West Indians | 0.0 /100 | #292 | Tragic 97.2% |
| Malaysians | 0.0 /100 | #293 | Tragic 97.2% |
| Immigrants | Grenada | 0.0 /100 | #294 | Tragic 97.2% |
| Immigrants | Immigrants | 0.0 /100 | #295 | Tragic 97.2% |
| Immigrants | Eritrea | 0.0 /100 | #296 | Tragic 97.2% |
| Central American Indians | 0.0 /100 | #297 | Tragic 97.1% |
| Immigrants | Dominica | 0.0 /100 | #298 | Tragic 97.1% |
| Immigrants | Cuba | 0.0 /100 | #299 | Tragic 97.1% |
| Haitians | 0.0 /100 | #300 | Tragic 97.1% |
| Immigrants | South Eastern Asia | 0.0 /100 | #301 | Tragic 97.1% |