Kenyan vs Immigrants from Belgium In Labor Force | Age 25-29
COMPARE
Kenyan
Immigrants from Belgium
In Labor Force | Age 25-29
In Labor Force | Age 25-29 Comparison
Kenyans
Immigrants from Belgium
85.4%
IN LABOR FORCE | AGE 25-29
99.0/ 100
METRIC RATING
71st/ 347
METRIC RANK
84.6%
IN LABOR FORCE | AGE 25-29
35.0/ 100
METRIC RATING
186th/ 347
METRIC RANK
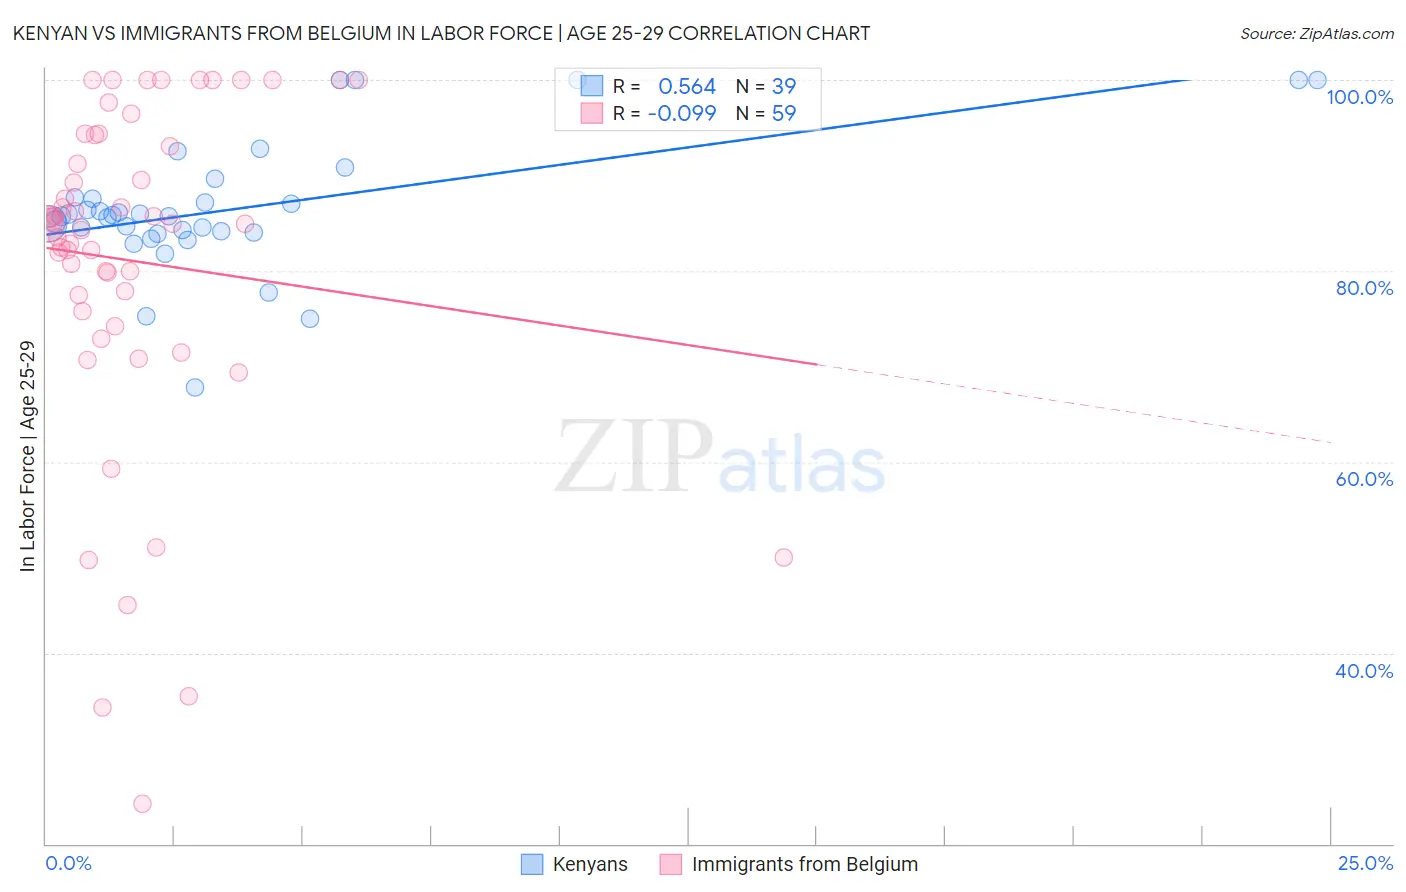
Kenyan vs Immigrants from Belgium In Labor Force | Age 25-29 Correlation Chart
The statistical analysis conducted on geographies consisting of 168,218,619 people shows a substantial positive correlation between the proportion of Kenyans and labor force participation rate among population between the ages 25 and 29 in the United States with a correlation coefficient (R) of 0.564 and weighted average of 85.4%. Similarly, the statistical analysis conducted on geographies consisting of 146,686,004 people shows a slight negative correlation between the proportion of Immigrants from Belgium and labor force participation rate among population between the ages 25 and 29 in the United States with a correlation coefficient (R) of -0.099 and weighted average of 84.6%, a difference of 0.96%.
In Labor Force | Age 25-29 Correlation Summary
| Measurement | Kenyan | Immigrants from Belgium |
| Minimum | 67.8% | 24.2% |
| Maximum | 100.0% | 100.0% |
| Range | 32.2% | 75.8% |
| Mean | 86.6% | 81.0% |
| Median | 85.8% | 85.0% |
| Interquartile 25% (IQ1) | 84.1% | 75.8% |
| Interquartile 75% (IQ3) | 87.7% | 94.2% |
| Interquartile Range (IQR) | 3.6% | 18.4% |
| Standard Deviation (Sample) | 6.9% | 17.6% |
| Standard Deviation (Population) | 6.8% | 17.5% |
Similar Demographics by In Labor Force | Age 25-29
Demographics Similar to Kenyans by In Labor Force | Age 25-29
In terms of in labor force | age 25-29, the demographic groups most similar to Kenyans are Menominee (85.4%, a difference of 0.020%), Immigrants from Sweden (85.4%, a difference of 0.020%), Immigrants from Australia (85.3%, a difference of 0.020%), Russian (85.3%, a difference of 0.030%), and Immigrants from Turkey (85.4%, a difference of 0.040%).
| Demographics | Rating | Rank | In Labor Force | Age 25-29 |
| Immigrants | Italy | 99.3 /100 | #64 | Exceptional 85.4% |
| Immigrants | Czechoslovakia | 99.3 /100 | #65 | Exceptional 85.4% |
| Immigrants | Scotland | 99.3 /100 | #66 | Exceptional 85.4% |
| Immigrants | Turkey | 99.2 /100 | #67 | Exceptional 85.4% |
| Immigrants | Cameroon | 99.2 /100 | #68 | Exceptional 85.4% |
| Menominee | 99.1 /100 | #69 | Exceptional 85.4% |
| Immigrants | Sweden | 99.1 /100 | #70 | Exceptional 85.4% |
| Kenyans | 99.0 /100 | #71 | Exceptional 85.4% |
| Immigrants | Australia | 98.9 /100 | #72 | Exceptional 85.3% |
| Russians | 98.8 /100 | #73 | Exceptional 85.3% |
| Soviet Union | 98.5 /100 | #74 | Exceptional 85.3% |
| Brazilians | 98.3 /100 | #75 | Exceptional 85.3% |
| Germans | 98.1 /100 | #76 | Exceptional 85.3% |
| Immigrants | South Central Asia | 97.9 /100 | #77 | Exceptional 85.2% |
| Immigrants | Egypt | 97.7 /100 | #78 | Exceptional 85.2% |
Demographics Similar to Immigrants from Belgium by In Labor Force | Age 25-29
In terms of in labor force | age 25-29, the demographic groups most similar to Immigrants from Belgium are Immigrants from Portugal (84.6%, a difference of 0.0%), Immigrants from Ukraine (84.5%, a difference of 0.010%), Immigrants from Denmark (84.6%, a difference of 0.020%), Moroccan (84.5%, a difference of 0.020%), and Immigrants from Kuwait (84.6%, a difference of 0.030%).
| Demographics | Rating | Rank | In Labor Force | Age 25-29 |
| Immigrants | Argentina | 44.0 /100 | #179 | Average 84.6% |
| Immigrants | South America | 42.9 /100 | #180 | Average 84.6% |
| Immigrants | Norway | 41.9 /100 | #181 | Average 84.6% |
| Europeans | 40.3 /100 | #182 | Average 84.6% |
| Scottish | 40.1 /100 | #183 | Average 84.6% |
| Immigrants | Kuwait | 38.2 /100 | #184 | Fair 84.6% |
| Immigrants | Denmark | 37.0 /100 | #185 | Fair 84.6% |
| Immigrants | Belgium | 35.0 /100 | #186 | Fair 84.6% |
| Immigrants | Portugal | 34.7 /100 | #187 | Fair 84.6% |
| Immigrants | Ukraine | 33.7 /100 | #188 | Fair 84.5% |
| Moroccans | 32.6 /100 | #189 | Fair 84.5% |
| Welsh | 31.1 /100 | #190 | Fair 84.5% |
| Zimbabweans | 28.7 /100 | #191 | Fair 84.5% |
| English | 25.8 /100 | #192 | Fair 84.5% |
| South American Indians | 25.0 /100 | #193 | Fair 84.5% |