Chilean vs Immigrants from Grenada In Labor Force | Age 25-29
COMPARE
Chilean
Immigrants from Grenada
In Labor Force | Age 25-29
In Labor Force | Age 25-29 Comparison
Chileans
Immigrants from Grenada
85.0%
IN LABOR FORCE | AGE 25-29
88.8/ 100
METRIC RATING
116th/ 347
METRIC RANK
82.8%
IN LABOR FORCE | AGE 25-29
0.0/ 100
METRIC RATING
303rd/ 347
METRIC RANK
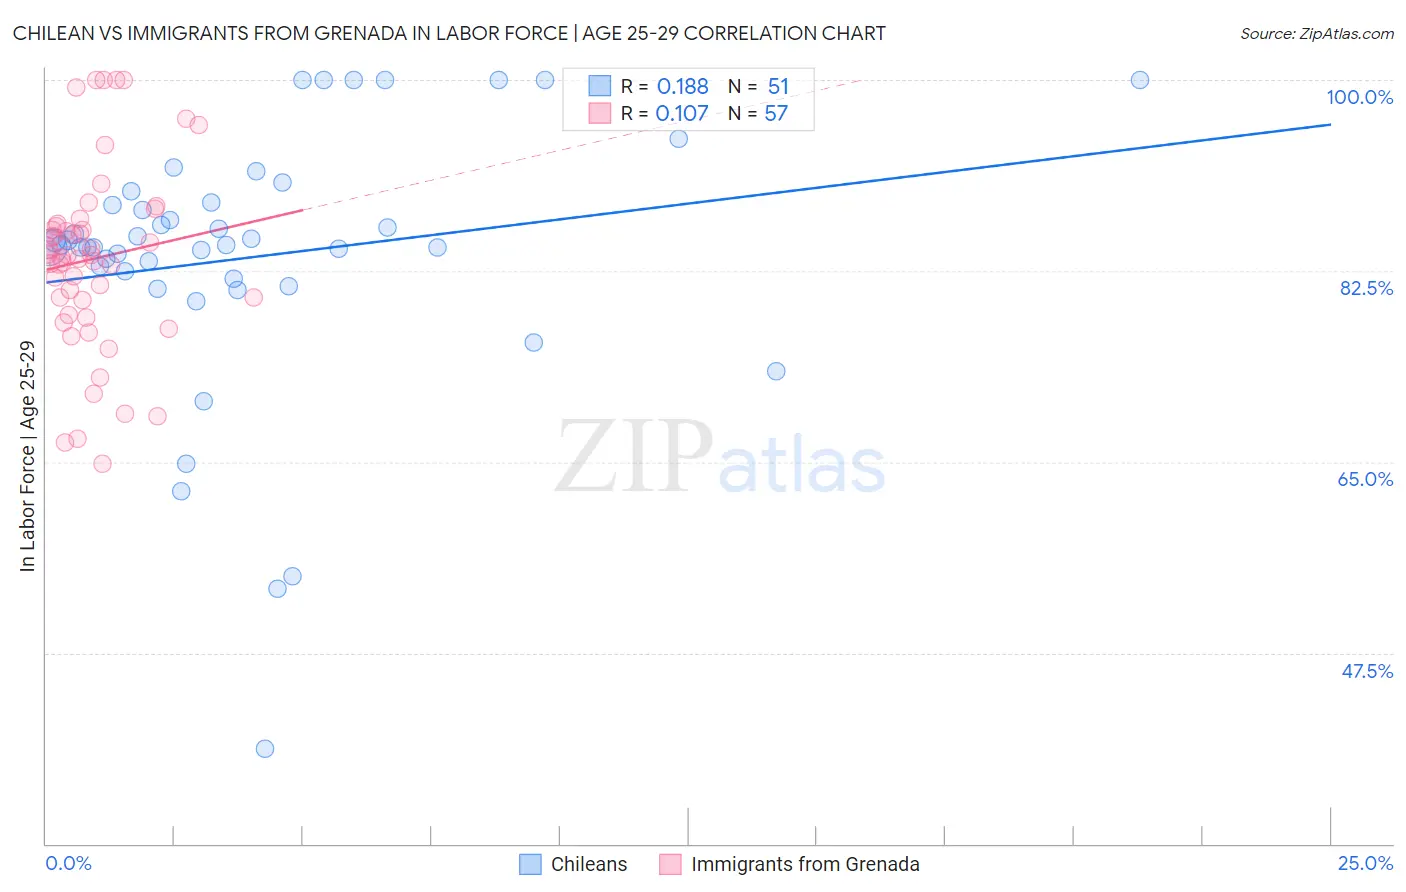
Chilean vs Immigrants from Grenada In Labor Force | Age 25-29 Correlation Chart
The statistical analysis conducted on geographies consisting of 256,647,437 people shows a poor positive correlation between the proportion of Chileans and labor force participation rate among population between the ages 25 and 29 in the United States with a correlation coefficient (R) of 0.188 and weighted average of 85.0%. Similarly, the statistical analysis conducted on geographies consisting of 67,199,109 people shows a poor positive correlation between the proportion of Immigrants from Grenada and labor force participation rate among population between the ages 25 and 29 in the United States with a correlation coefficient (R) of 0.107 and weighted average of 82.8%, a difference of 2.6%.
In Labor Force | Age 25-29 Correlation Summary
| Measurement | Chilean | Immigrants from Grenada |
| Minimum | 38.7% | 64.8% |
| Maximum | 100.0% | 100.0% |
| Range | 61.3% | 35.2% |
| Mean | 83.8% | 83.6% |
| Median | 84.8% | 84.0% |
| Interquartile 25% (IQ1) | 81.8% | 79.2% |
| Interquartile 75% (IQ3) | 88.8% | 86.7% |
| Interquartile Range (IQR) | 7.0% | 7.6% |
| Standard Deviation (Sample) | 12.1% | 8.3% |
| Standard Deviation (Population) | 12.0% | 8.3% |
Similar Demographics by In Labor Force | Age 25-29
Demographics Similar to Chileans by In Labor Force | Age 25-29
In terms of in labor force | age 25-29, the demographic groups most similar to Chileans are South African (85.0%, a difference of 0.0%), Immigrants from Belarus (85.0%, a difference of 0.020%), Finnish (85.0%, a difference of 0.020%), Immigrants from Malaysia (85.0%, a difference of 0.030%), and Filipino (84.9%, a difference of 0.030%).
| Demographics | Rating | Rank | In Labor Force | Age 25-29 |
| Costa Ricans | 91.9 /100 | #109 | Exceptional 85.0% |
| New Zealanders | 91.5 /100 | #110 | Exceptional 85.0% |
| Immigrants | Middle Africa | 91.4 /100 | #111 | Exceptional 85.0% |
| Senegalese | 90.9 /100 | #112 | Exceptional 85.0% |
| Irish | 90.6 /100 | #113 | Exceptional 85.0% |
| Immigrants | Malaysia | 90.4 /100 | #114 | Exceptional 85.0% |
| South Africans | 88.9 /100 | #115 | Excellent 85.0% |
| Chileans | 88.8 /100 | #116 | Excellent 85.0% |
| Immigrants | Belarus | 88.0 /100 | #117 | Excellent 85.0% |
| Finns | 87.8 /100 | #118 | Excellent 85.0% |
| Filipinos | 87.1 /100 | #119 | Excellent 84.9% |
| Immigrants | South Africa | 86.1 /100 | #120 | Excellent 84.9% |
| Immigrants | Chile | 85.6 /100 | #121 | Excellent 84.9% |
| Scandinavians | 85.1 /100 | #122 | Excellent 84.9% |
| Dutch | 84.9 /100 | #123 | Excellent 84.9% |
Demographics Similar to Immigrants from Grenada by In Labor Force | Age 25-29
In terms of in labor force | age 25-29, the demographic groups most similar to Immigrants from Grenada are Immigrants from Belize (82.8%, a difference of 0.010%), Vietnamese (82.8%, a difference of 0.050%), Spanish American Indian (82.9%, a difference of 0.11%), Fijian (82.9%, a difference of 0.12%), and Immigrants from St. Vincent and the Grenadines (82.7%, a difference of 0.12%).
| Demographics | Rating | Rank | In Labor Force | Age 25-29 |
| Immigrants | Nicaragua | 0.0 /100 | #296 | Tragic 82.9% |
| Potawatomi | 0.0 /100 | #297 | Tragic 82.9% |
| Native Hawaiians | 0.0 /100 | #298 | Tragic 82.9% |
| Fijians | 0.0 /100 | #299 | Tragic 82.9% |
| Spanish American Indians | 0.0 /100 | #300 | Tragic 82.9% |
| Vietnamese | 0.0 /100 | #301 | Tragic 82.8% |
| Immigrants | Belize | 0.0 /100 | #302 | Tragic 82.8% |
| Immigrants | Grenada | 0.0 /100 | #303 | Tragic 82.8% |
| Immigrants | St. Vincent and the Grenadines | 0.0 /100 | #304 | Tragic 82.7% |
| Blacks/African Americans | 0.0 /100 | #305 | Tragic 82.6% |
| Blackfeet | 0.0 /100 | #306 | Tragic 82.6% |
| Cajuns | 0.0 /100 | #307 | Tragic 82.5% |
| Central American Indians | 0.0 /100 | #308 | Tragic 82.4% |
| Immigrants | Central America | 0.0 /100 | #309 | Tragic 82.4% |
| Osage | 0.0 /100 | #310 | Tragic 82.3% |