Kenyan vs Immigrants from Grenada 8th Grade
COMPARE
Kenyan
Immigrants from Grenada
8th Grade
8th Grade Comparison
Kenyans
Immigrants from Grenada
95.9%
8TH GRADE
74.5/ 100
METRIC RATING
155th/ 347
METRIC RANK
94.3%
8TH GRADE
0.0/ 100
METRIC RATING
291st/ 347
METRIC RANK
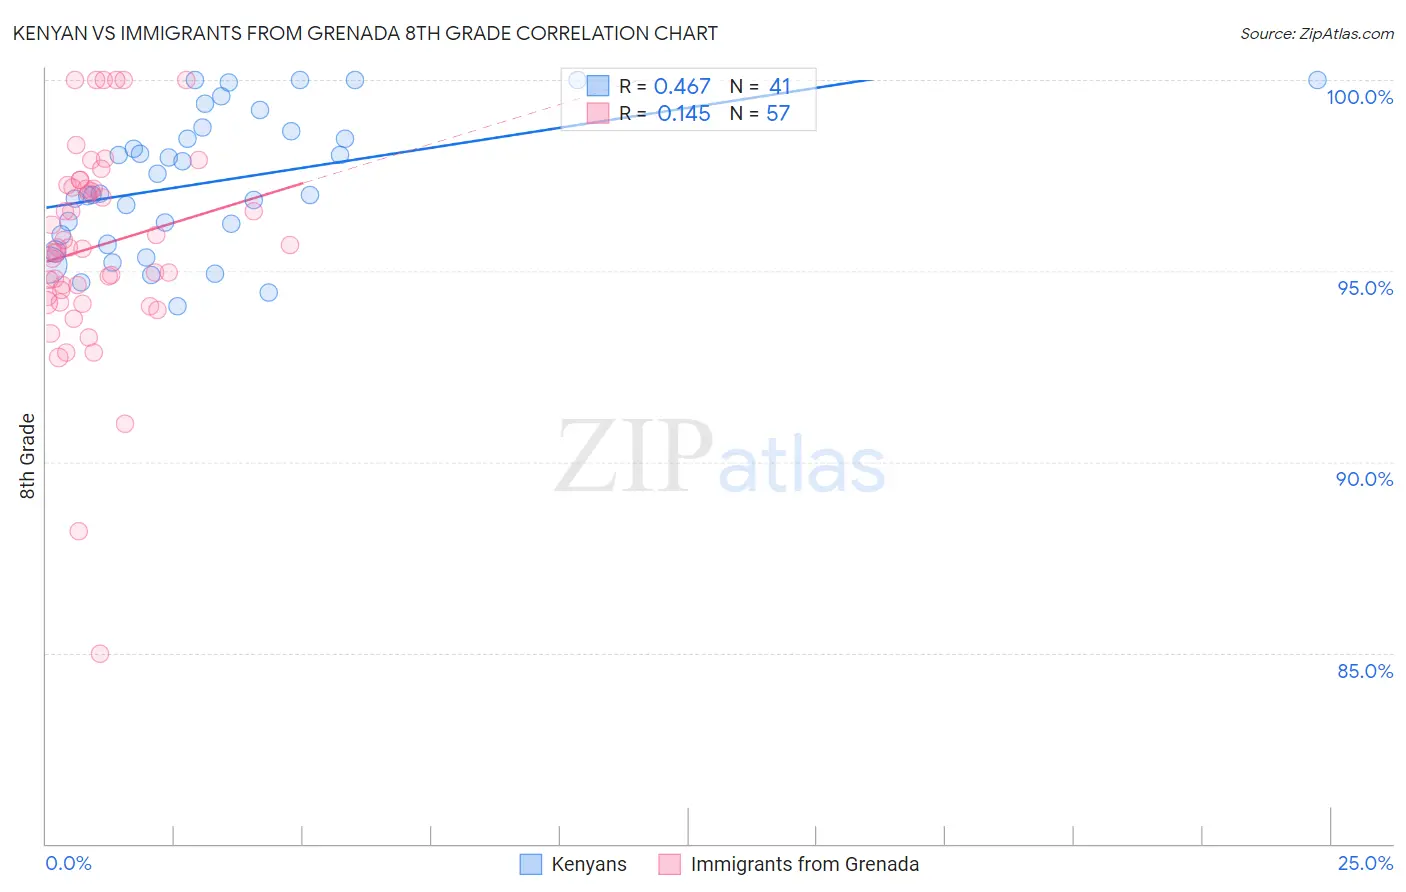
Kenyan vs Immigrants from Grenada 8th Grade Correlation Chart
The statistical analysis conducted on geographies consisting of 168,244,042 people shows a moderate positive correlation between the proportion of Kenyans and percentage of population with at least 8th grade education in the United States with a correlation coefficient (R) of 0.467 and weighted average of 95.9%. Similarly, the statistical analysis conducted on geographies consisting of 67,192,275 people shows a poor positive correlation between the proportion of Immigrants from Grenada and percentage of population with at least 8th grade education in the United States with a correlation coefficient (R) of 0.145 and weighted average of 94.3%, a difference of 1.7%.
8th Grade Correlation Summary
| Measurement | Kenyan | Immigrants from Grenada |
| Minimum | 94.1% | 85.0% |
| Maximum | 100.0% | 100.0% |
| Range | 5.9% | 15.0% |
| Mean | 97.3% | 95.6% |
| Median | 97.0% | 95.6% |
| Interquartile 25% (IQ1) | 95.8% | 94.3% |
| Interquartile 75% (IQ3) | 98.7% | 97.2% |
| Interquartile Range (IQR) | 2.9% | 3.0% |
| Standard Deviation (Sample) | 1.8% | 2.7% |
| Standard Deviation (Population) | 1.8% | 2.7% |
Similar Demographics by 8th Grade
Demographics Similar to Kenyans by 8th Grade
In terms of 8th grade, the demographic groups most similar to Kenyans are Ugandan (95.9%, a difference of 0.0%), Immigrants from Taiwan (95.9%, a difference of 0.030%), Hopi (95.9%, a difference of 0.040%), Arab (95.9%, a difference of 0.040%), and Immigrants from Jordan (95.9%, a difference of 0.050%).
| Demographics | Rating | Rank | 8th Grade |
| Albanians | 83.1 /100 | #148 | Excellent 96.0% |
| Immigrants | Israel | 81.3 /100 | #149 | Excellent 96.0% |
| Immigrants | Russia | 80.9 /100 | #150 | Excellent 96.0% |
| Blackfeet | 80.8 /100 | #151 | Excellent 96.0% |
| French American Indians | 80.6 /100 | #152 | Excellent 96.0% |
| Immigrants | Jordan | 79.5 /100 | #153 | Good 95.9% |
| Hopi | 79.4 /100 | #154 | Good 95.9% |
| Kenyans | 74.5 /100 | #155 | Good 95.9% |
| Ugandans | 74.1 /100 | #156 | Good 95.9% |
| Immigrants | Taiwan | 70.5 /100 | #157 | Good 95.9% |
| Arabs | 69.4 /100 | #158 | Good 95.9% |
| Immigrants | Kazakhstan | 68.4 /100 | #159 | Good 95.9% |
| Seminole | 67.7 /100 | #160 | Good 95.8% |
| Bermudans | 67.5 /100 | #161 | Good 95.8% |
| Immigrants | Kenya | 67.2 /100 | #162 | Good 95.8% |
Demographics Similar to Immigrants from Grenada by 8th Grade
In terms of 8th grade, the demographic groups most similar to Immigrants from Grenada are Immigrants from West Indies (94.3%, a difference of 0.010%), Bangladeshi (94.3%, a difference of 0.070%), British West Indian (94.4%, a difference of 0.080%), Yaqui (94.2%, a difference of 0.10%), and Houma (94.2%, a difference of 0.10%).
| Demographics | Rating | Rank | 8th Grade |
| Immigrants | Philippines | 0.1 /100 | #284 | Tragic 94.6% |
| Immigrants | Barbados | 0.0 /100 | #285 | Tragic 94.5% |
| Immigrants | Peru | 0.0 /100 | #286 | Tragic 94.5% |
| Tohono O'odham | 0.0 /100 | #287 | Tragic 94.5% |
| Malaysians | 0.0 /100 | #288 | Tragic 94.5% |
| British West Indians | 0.0 /100 | #289 | Tragic 94.4% |
| Immigrants | West Indies | 0.0 /100 | #290 | Tragic 94.3% |
| Immigrants | Grenada | 0.0 /100 | #291 | Tragic 94.3% |
| Bangladeshis | 0.0 /100 | #292 | Tragic 94.3% |
| Yaqui | 0.0 /100 | #293 | Tragic 94.2% |
| Houma | 0.0 /100 | #294 | Tragic 94.2% |
| Fijians | 0.0 /100 | #295 | Tragic 94.2% |
| Haitians | 0.0 /100 | #296 | Tragic 94.2% |
| Immigrants | South Eastern Asia | 0.0 /100 | #297 | Tragic 94.2% |
| Indonesians | 0.0 /100 | #298 | Tragic 94.1% |