Kenyan vs Nonimmigrants In Labor Force | Age 25-29
COMPARE
Kenyan
Nonimmigrants
In Labor Force | Age 25-29
In Labor Force | Age 25-29 Comparison
Kenyans
Nonimmigrants
85.4%
IN LABOR FORCE | AGE 25-29
99.0/ 100
METRIC RATING
71st/ 347
METRIC RANK
83.7%
IN LABOR FORCE | AGE 25-29
0.3/ 100
METRIC RATING
248th/ 347
METRIC RANK
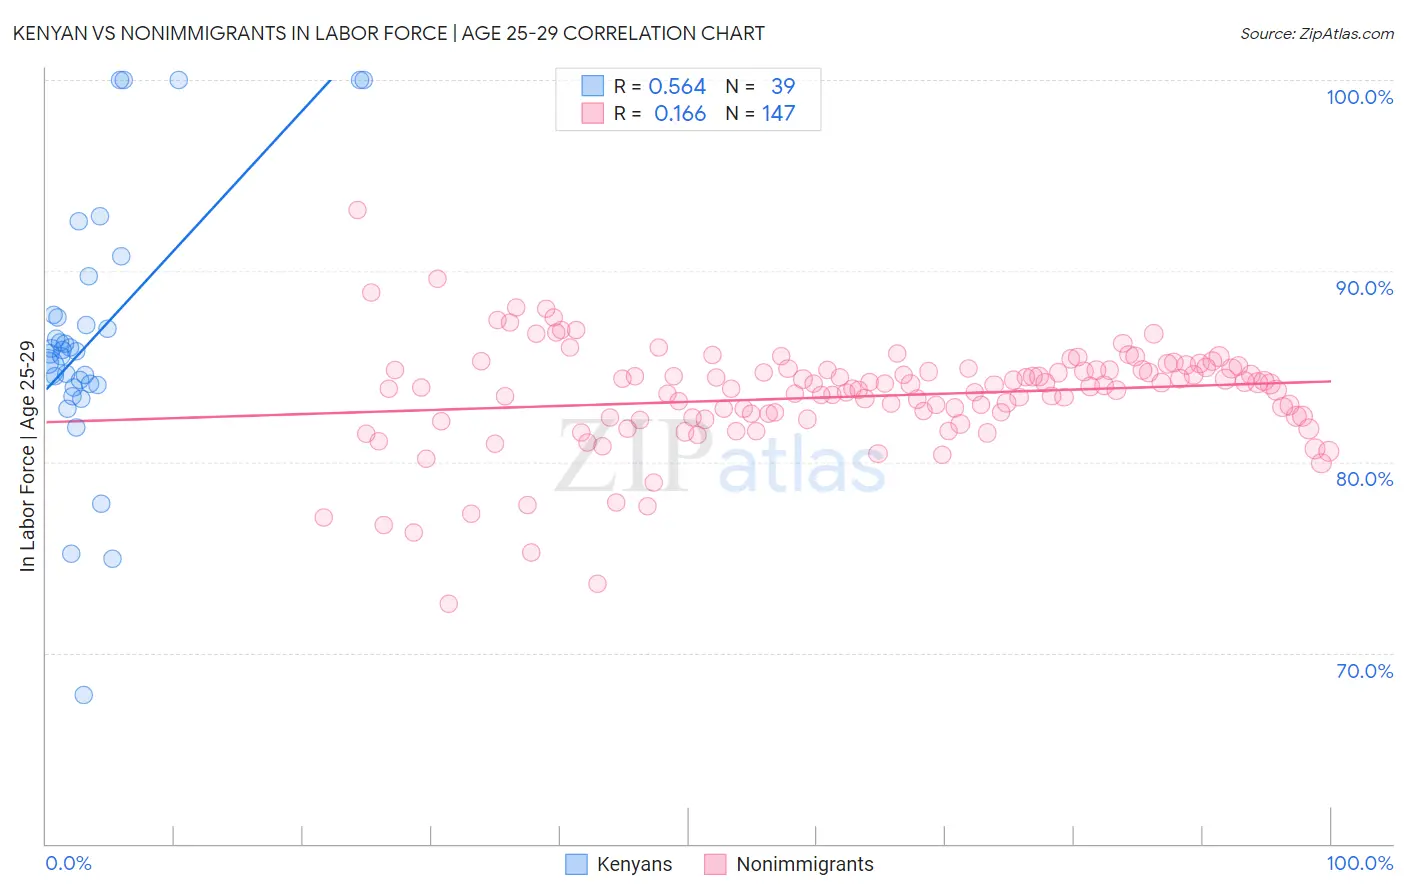
Kenyan vs Nonimmigrants In Labor Force | Age 25-29 Correlation Chart
The statistical analysis conducted on geographies consisting of 168,218,619 people shows a substantial positive correlation between the proportion of Kenyans and labor force participation rate among population between the ages 25 and 29 in the United States with a correlation coefficient (R) of 0.564 and weighted average of 85.4%. Similarly, the statistical analysis conducted on geographies consisting of 582,659,660 people shows a poor positive correlation between the proportion of Nonimmigrants and labor force participation rate among population between the ages 25 and 29 in the United States with a correlation coefficient (R) of 0.166 and weighted average of 83.7%, a difference of 2.0%.
In Labor Force | Age 25-29 Correlation Summary
| Measurement | Kenyan | Nonimmigrants |
| Minimum | 67.8% | 72.6% |
| Maximum | 100.0% | 93.2% |
| Range | 32.2% | 20.6% |
| Mean | 86.6% | 83.4% |
| Median | 85.8% | 83.9% |
| Interquartile 25% (IQ1) | 84.1% | 82.3% |
| Interquartile 75% (IQ3) | 87.7% | 84.8% |
| Interquartile Range (IQR) | 3.6% | 2.5% |
| Standard Deviation (Sample) | 6.9% | 2.8% |
| Standard Deviation (Population) | 6.8% | 2.8% |
Similar Demographics by In Labor Force | Age 25-29
Demographics Similar to Kenyans by In Labor Force | Age 25-29
In terms of in labor force | age 25-29, the demographic groups most similar to Kenyans are Menominee (85.4%, a difference of 0.020%), Immigrants from Sweden (85.4%, a difference of 0.020%), Immigrants from Australia (85.3%, a difference of 0.020%), Russian (85.3%, a difference of 0.030%), and Immigrants from Turkey (85.4%, a difference of 0.040%).
| Demographics | Rating | Rank | In Labor Force | Age 25-29 |
| Immigrants | Italy | 99.3 /100 | #64 | Exceptional 85.4% |
| Immigrants | Czechoslovakia | 99.3 /100 | #65 | Exceptional 85.4% |
| Immigrants | Scotland | 99.3 /100 | #66 | Exceptional 85.4% |
| Immigrants | Turkey | 99.2 /100 | #67 | Exceptional 85.4% |
| Immigrants | Cameroon | 99.2 /100 | #68 | Exceptional 85.4% |
| Menominee | 99.1 /100 | #69 | Exceptional 85.4% |
| Immigrants | Sweden | 99.1 /100 | #70 | Exceptional 85.4% |
| Kenyans | 99.0 /100 | #71 | Exceptional 85.4% |
| Immigrants | Australia | 98.9 /100 | #72 | Exceptional 85.3% |
| Russians | 98.8 /100 | #73 | Exceptional 85.3% |
| Soviet Union | 98.5 /100 | #74 | Exceptional 85.3% |
| Brazilians | 98.3 /100 | #75 | Exceptional 85.3% |
| Germans | 98.1 /100 | #76 | Exceptional 85.3% |
| Immigrants | South Central Asia | 97.9 /100 | #77 | Exceptional 85.2% |
| Immigrants | Egypt | 97.7 /100 | #78 | Exceptional 85.2% |
Demographics Similar to Nonimmigrants by In Labor Force | Age 25-29
In terms of in labor force | age 25-29, the demographic groups most similar to Nonimmigrants are Hmong (83.7%, a difference of 0.010%), Immigrants from El Salvador (83.7%, a difference of 0.020%), Cree (83.8%, a difference of 0.030%), Central American (83.7%, a difference of 0.030%), and Bahamian (83.7%, a difference of 0.040%).
| Demographics | Rating | Rank | In Labor Force | Age 25-29 |
| Alsatians | 0.7 /100 | #241 | Tragic 83.9% |
| U.S. Virgin Islanders | 0.6 /100 | #242 | Tragic 83.8% |
| Salvadorans | 0.5 /100 | #243 | Tragic 83.8% |
| Immigrants | Jamaica | 0.4 /100 | #244 | Tragic 83.8% |
| Iroquois | 0.4 /100 | #245 | Tragic 83.8% |
| Cree | 0.3 /100 | #246 | Tragic 83.8% |
| Immigrants | El Salvador | 0.3 /100 | #247 | Tragic 83.7% |
| Immigrants | Nonimmigrants | 0.3 /100 | #248 | Tragic 83.7% |
| Hmong | 0.3 /100 | #249 | Tragic 83.7% |
| Central Americans | 0.2 /100 | #250 | Tragic 83.7% |
| Bahamians | 0.2 /100 | #251 | Tragic 83.7% |
| Guatemalans | 0.2 /100 | #252 | Tragic 83.7% |
| Immigrants | Trinidad and Tobago | 0.2 /100 | #253 | Tragic 83.7% |
| Spaniards | 0.2 /100 | #254 | Tragic 83.7% |
| Haitians | 0.2 /100 | #255 | Tragic 83.7% |