Spaniard vs Houma In Labor Force | Age 20-64
COMPARE
Spaniard
Houma
In Labor Force | Age 20-64
In Labor Force | Age 20-64 Comparison
Spaniards
Houma
78.4%
IN LABOR FORCE | AGE 20-64
0.1/ 100
METRIC RATING
264th/ 347
METRIC RANK
72.7%
IN LABOR FORCE | AGE 20-64
0.0/ 100
METRIC RATING
339th/ 347
METRIC RANK
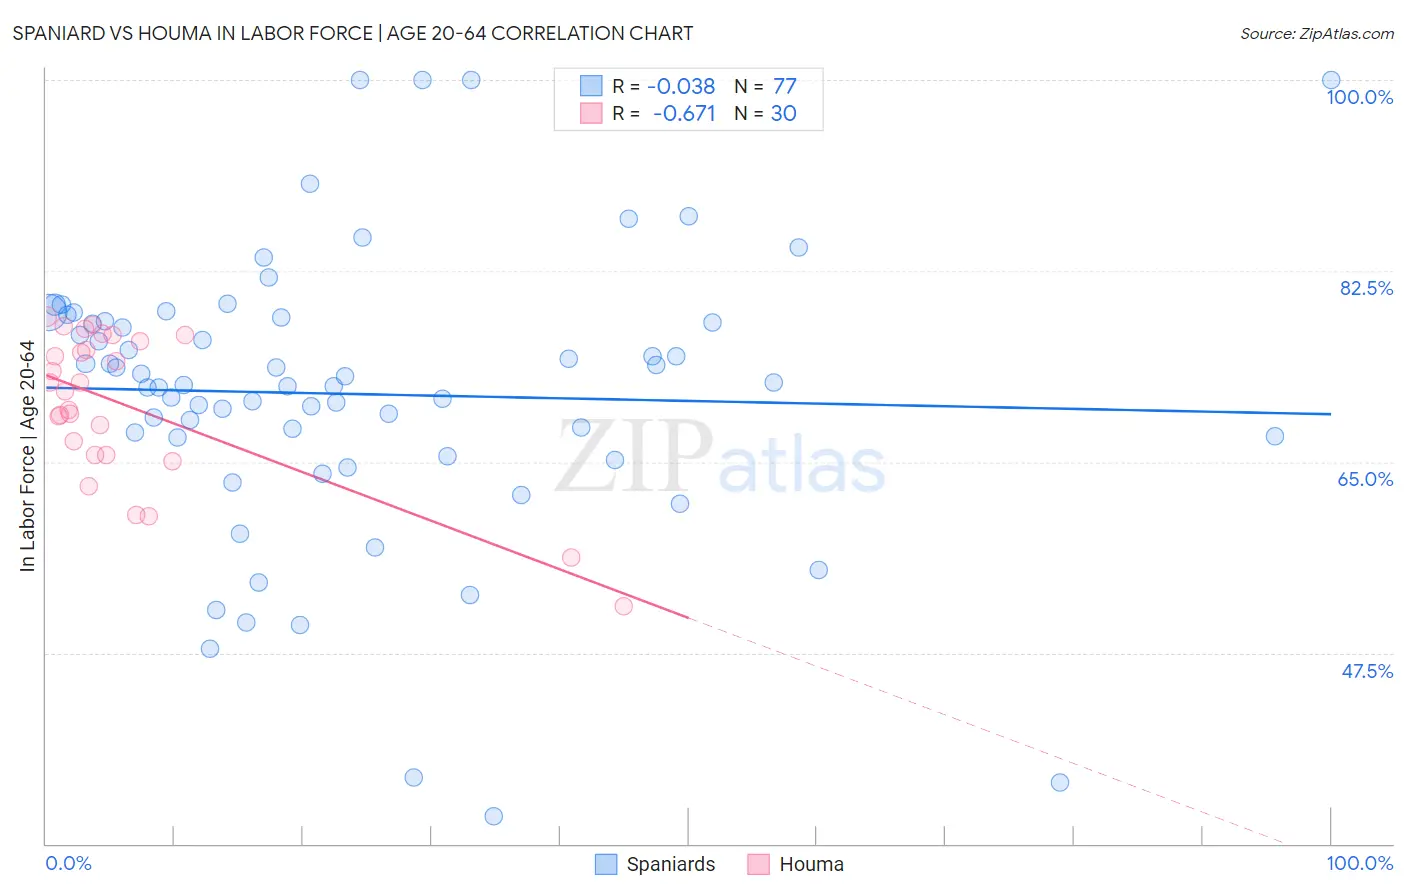
Spaniard vs Houma In Labor Force | Age 20-64 Correlation Chart
The statistical analysis conducted on geographies consisting of 443,546,282 people shows no correlation between the proportion of Spaniards and labor force participation rate among population between the ages 20 and 64 in the United States with a correlation coefficient (R) of -0.038 and weighted average of 78.4%. Similarly, the statistical analysis conducted on geographies consisting of 36,797,748 people shows a significant negative correlation between the proportion of Houma and labor force participation rate among population between the ages 20 and 64 in the United States with a correlation coefficient (R) of -0.671 and weighted average of 72.7%, a difference of 7.8%.
In Labor Force | Age 20-64 Correlation Summary
| Measurement | Spaniard | Houma |
| Minimum | 32.5% | 51.8% |
| Maximum | 100.0% | 78.3% |
| Range | 67.5% | 26.5% |
| Mean | 71.2% | 70.2% |
| Median | 72.1% | 71.9% |
| Interquartile 25% (IQ1) | 66.4% | 65.6% |
| Interquartile 75% (IQ3) | 78.0% | 76.1% |
| Interquartile Range (IQR) | 11.7% | 10.5% |
| Standard Deviation (Sample) | 13.2% | 6.9% |
| Standard Deviation (Population) | 13.1% | 6.7% |
Similar Demographics by In Labor Force | Age 20-64
Demographics Similar to Spaniards by In Labor Force | Age 20-64
In terms of in labor force | age 20-64, the demographic groups most similar to Spaniards are Pennsylvania German (78.4%, a difference of 0.010%), Fijian (78.4%, a difference of 0.020%), British West Indian (78.4%, a difference of 0.040%), Bahamian (78.4%, a difference of 0.050%), and U.S. Virgin Islander (78.4%, a difference of 0.070%).
| Demographics | Rating | Rank | In Labor Force | Age 20-64 |
| Guatemalans | 0.4 /100 | #257 | Tragic 78.7% |
| Immigrants | Guatemala | 0.4 /100 | #258 | Tragic 78.7% |
| Tsimshian | 0.4 /100 | #259 | Tragic 78.7% |
| Immigrants | Fiji | 0.3 /100 | #260 | Tragic 78.6% |
| Whites/Caucasians | 0.2 /100 | #261 | Tragic 78.5% |
| Fijians | 0.1 /100 | #262 | Tragic 78.4% |
| Pennsylvania Germans | 0.1 /100 | #263 | Tragic 78.4% |
| Spaniards | 0.1 /100 | #264 | Tragic 78.4% |
| British West Indians | 0.1 /100 | #265 | Tragic 78.4% |
| Bahamians | 0.1 /100 | #266 | Tragic 78.4% |
| U.S. Virgin Islanders | 0.1 /100 | #267 | Tragic 78.4% |
| West Indians | 0.0 /100 | #268 | Tragic 78.3% |
| Immigrants | Barbados | 0.0 /100 | #269 | Tragic 78.3% |
| Scotch-Irish | 0.0 /100 | #270 | Tragic 78.3% |
| Immigrants | Latin America | 0.0 /100 | #271 | Tragic 78.3% |
Demographics Similar to Houma by In Labor Force | Age 20-64
In terms of in labor force | age 20-64, the demographic groups most similar to Houma are Pueblo (72.6%, a difference of 0.15%), Puerto Rican (73.1%, a difference of 0.43%), Yup'ik (73.2%, a difference of 0.64%), Immigrants from Yemen (72.3%, a difference of 0.64%), and Crow (73.3%, a difference of 0.76%).
| Demographics | Rating | Rank | In Labor Force | Age 20-64 |
| Arapaho | 0.0 /100 | #332 | Tragic 74.4% |
| Natives/Alaskans | 0.0 /100 | #333 | Tragic 73.9% |
| Apache | 0.0 /100 | #334 | Tragic 73.7% |
| Ute | 0.0 /100 | #335 | Tragic 73.7% |
| Crow | 0.0 /100 | #336 | Tragic 73.3% |
| Yup'ik | 0.0 /100 | #337 | Tragic 73.2% |
| Puerto Ricans | 0.0 /100 | #338 | Tragic 73.1% |
| Houma | 0.0 /100 | #339 | Tragic 72.7% |
| Pueblo | 0.0 /100 | #340 | Tragic 72.6% |
| Immigrants | Yemen | 0.0 /100 | #341 | Tragic 72.3% |
| Yuman | 0.0 /100 | #342 | Tragic 71.7% |
| Hopi | 0.0 /100 | #343 | Tragic 71.7% |
| Lumbee | 0.0 /100 | #344 | Tragic 70.6% |
| Tohono O'odham | 0.0 /100 | #345 | Tragic 70.4% |
| Navajo | 0.0 /100 | #346 | Tragic 69.2% |