South African vs Houma In Labor Force | Age 20-64
COMPARE
South African
Houma
In Labor Force | Age 20-64
In Labor Force | Age 20-64 Comparison
South Africans
Houma
79.7%
IN LABOR FORCE | AGE 20-64
66.2/ 100
METRIC RATING
161st/ 347
METRIC RANK
72.7%
IN LABOR FORCE | AGE 20-64
0.0/ 100
METRIC RATING
339th/ 347
METRIC RANK
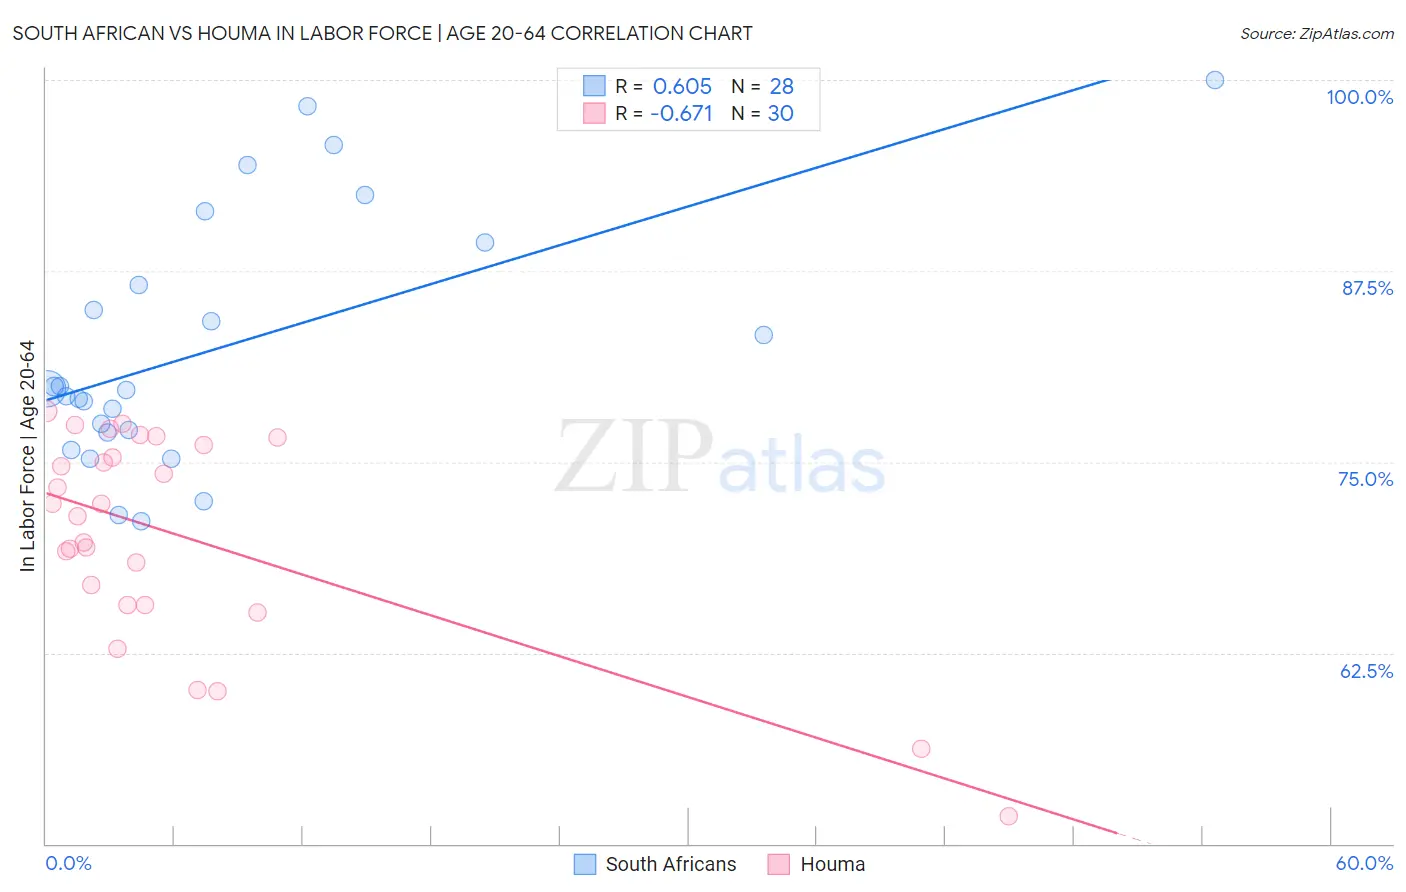
South African vs Houma In Labor Force | Age 20-64 Correlation Chart
The statistical analysis conducted on geographies consisting of 182,600,467 people shows a significant positive correlation between the proportion of South Africans and labor force participation rate among population between the ages 20 and 64 in the United States with a correlation coefficient (R) of 0.605 and weighted average of 79.7%. Similarly, the statistical analysis conducted on geographies consisting of 36,797,748 people shows a significant negative correlation between the proportion of Houma and labor force participation rate among population between the ages 20 and 64 in the United States with a correlation coefficient (R) of -0.671 and weighted average of 72.7%, a difference of 9.5%.
In Labor Force | Age 20-64 Correlation Summary
| Measurement | South African | Houma |
| Minimum | 71.1% | 51.8% |
| Maximum | 100.0% | 78.3% |
| Range | 28.9% | 26.5% |
| Mean | 82.4% | 70.2% |
| Median | 79.7% | 71.9% |
| Interquartile 25% (IQ1) | 77.0% | 65.6% |
| Interquartile 75% (IQ3) | 88.0% | 76.1% |
| Interquartile Range (IQR) | 11.0% | 10.5% |
| Standard Deviation (Sample) | 8.1% | 6.9% |
| Standard Deviation (Population) | 8.0% | 6.7% |
Similar Demographics by In Labor Force | Age 20-64
Demographics Similar to South Africans by In Labor Force | Age 20-64
In terms of in labor force | age 20-64, the demographic groups most similar to South Africans are Immigrants from Cuba (79.7%, a difference of 0.0%), Moroccan (79.7%, a difference of 0.0%), Austrian (79.7%, a difference of 0.010%), German (79.7%, a difference of 0.010%), and Immigrants from Costa Rica (79.7%, a difference of 0.010%).
| Demographics | Rating | Rank | In Labor Force | Age 20-64 |
| New Zealanders | 69.4 /100 | #154 | Good 79.7% |
| Immigrants | South Africa | 69.2 /100 | #155 | Good 79.7% |
| Senegalese | 69.1 /100 | #156 | Good 79.7% |
| Immigrants | China | 69.1 /100 | #157 | Good 79.7% |
| Austrians | 67.6 /100 | #158 | Good 79.7% |
| Immigrants | Cuba | 66.7 /100 | #159 | Good 79.7% |
| Moroccans | 66.7 /100 | #160 | Good 79.7% |
| South Africans | 66.2 /100 | #161 | Good 79.7% |
| Germans | 65.2 /100 | #162 | Good 79.7% |
| Immigrants | Costa Rica | 64.6 /100 | #163 | Good 79.7% |
| Immigrants | Burma/Myanmar | 64.4 /100 | #164 | Good 79.7% |
| Nigerians | 64.0 /100 | #165 | Good 79.7% |
| Okinawans | 62.7 /100 | #166 | Good 79.6% |
| Immigrants | Iraq | 62.0 /100 | #167 | Good 79.6% |
| Immigrants | Indonesia | 61.8 /100 | #168 | Good 79.6% |
Demographics Similar to Houma by In Labor Force | Age 20-64
In terms of in labor force | age 20-64, the demographic groups most similar to Houma are Pueblo (72.6%, a difference of 0.15%), Puerto Rican (73.1%, a difference of 0.43%), Yup'ik (73.2%, a difference of 0.64%), Immigrants from Yemen (72.3%, a difference of 0.64%), and Crow (73.3%, a difference of 0.76%).
| Demographics | Rating | Rank | In Labor Force | Age 20-64 |
| Arapaho | 0.0 /100 | #332 | Tragic 74.4% |
| Natives/Alaskans | 0.0 /100 | #333 | Tragic 73.9% |
| Apache | 0.0 /100 | #334 | Tragic 73.7% |
| Ute | 0.0 /100 | #335 | Tragic 73.7% |
| Crow | 0.0 /100 | #336 | Tragic 73.3% |
| Yup'ik | 0.0 /100 | #337 | Tragic 73.2% |
| Puerto Ricans | 0.0 /100 | #338 | Tragic 73.1% |
| Houma | 0.0 /100 | #339 | Tragic 72.7% |
| Pueblo | 0.0 /100 | #340 | Tragic 72.6% |
| Immigrants | Yemen | 0.0 /100 | #341 | Tragic 72.3% |
| Yuman | 0.0 /100 | #342 | Tragic 71.7% |
| Hopi | 0.0 /100 | #343 | Tragic 71.7% |
| Lumbee | 0.0 /100 | #344 | Tragic 70.6% |
| Tohono O'odham | 0.0 /100 | #345 | Tragic 70.4% |
| Navajo | 0.0 /100 | #346 | Tragic 69.2% |