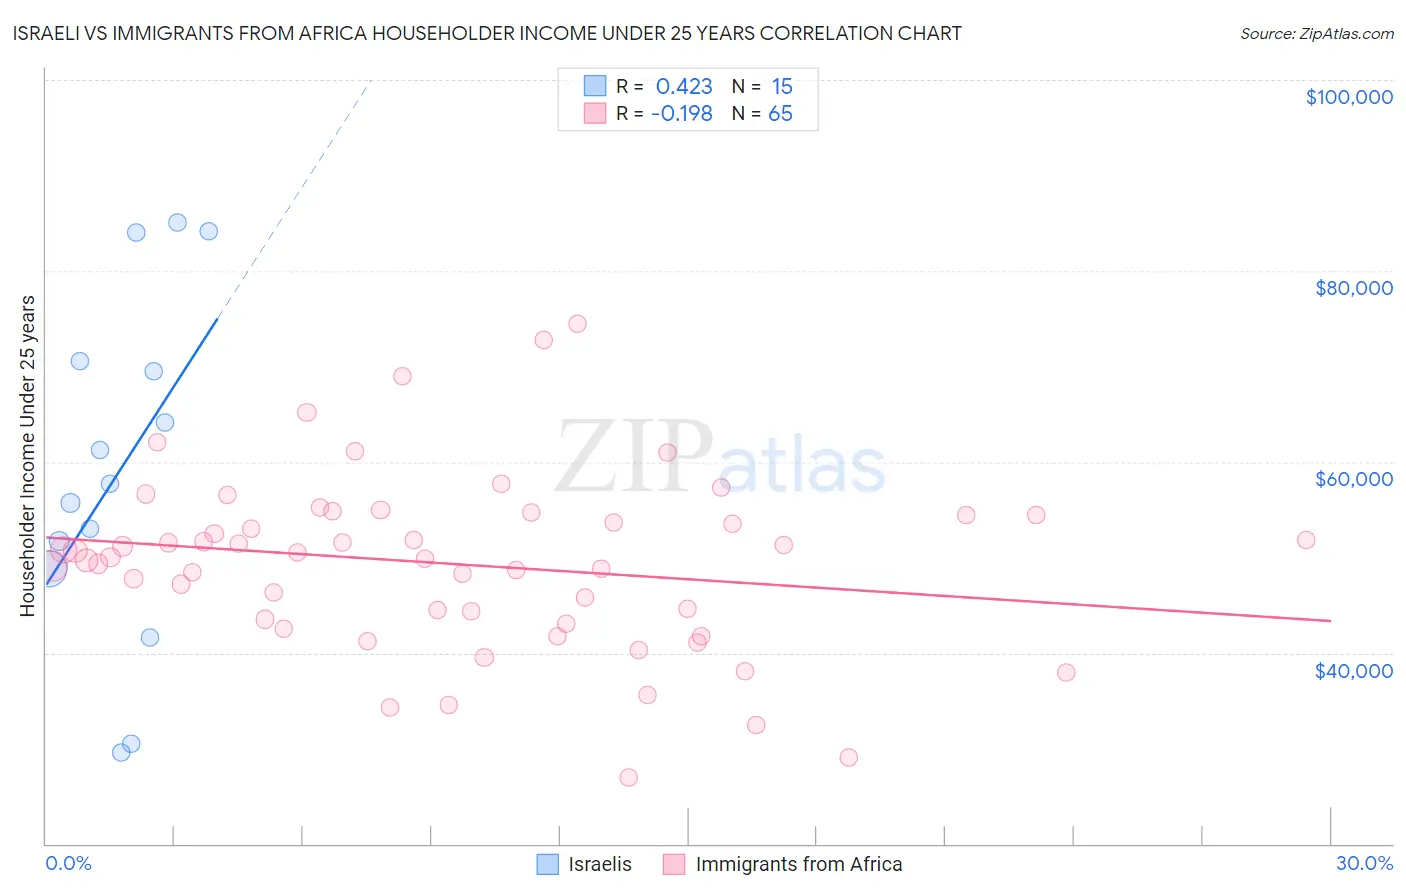
Israeli vs Immigrants from Africa Householder Income Under 25 years
COMPARE
Israeli
Immigrants from Africa
Householder Income Under 25 years
Householder Income Under 25 years Comparison
Israelis
Immigrants from Africa
$52,335
HOUSEHOLDER INCOME UNDER 25 YEARS
58.8/ 100
METRIC RATING
170th/ 347
METRIC RANK
$50,609
HOUSEHOLDER INCOME UNDER 25 YEARS
2.0/ 100
METRIC RATING
245th/ 347
METRIC RANK
Israeli vs Immigrants from Africa Householder Income Under 25 years Correlation Chart
The statistical analysis conducted on geographies consisting of 185,385,963 people shows a moderate positive correlation between the proportion of Israelis and household income with householder under the age of 25 in the United States with a correlation coefficient (R) of 0.423 and weighted average of $52,335. Similarly, the statistical analysis conducted on geographies consisting of 387,551,997 people shows a poor negative correlation between the proportion of Immigrants from Africa and household income with householder under the age of 25 in the United States with a correlation coefficient (R) of -0.198 and weighted average of $50,609, a difference of 3.4%.
Householder Income Under 25 years Correlation Summary
| Measurement | Israeli | Immigrants from Africa |
| Minimum | $29,603 | $26,950 |
| Maximum | $85,068 | $74,456 |
| Range | $55,465 | $47,507 |
| Mean | $59,148 | $49,315 |
| Median | $57,661 | $49,967 |
| Interquartile 25% (IQ1) | $48,868 | $43,274 |
| Interquartile 75% (IQ3) | $70,580 | $54,425 |
| Interquartile Range (IQR) | $21,712 | $11,151 |
| Standard Deviation (Sample) | $17,724 | $9,288 |
| Standard Deviation (Population) | $17,123 | $9,217 |
Similar Demographics by Householder Income Under 25 years
Demographics Similar to Israelis by Householder Income Under 25 years
In terms of householder income under 25 years, the demographic groups most similar to Israelis are Canadian ($52,336, a difference of 0.0%), Japanese ($52,365, a difference of 0.060%), Immigrants from Uruguay ($52,302, a difference of 0.060%), Immigrants from Uganda ($52,374, a difference of 0.070%), and Immigrants from Austria ($52,400, a difference of 0.12%).
| Demographics | Rating | Rank | Householder Income Under 25 years |
| Immigrants | Chile | 64.8 /100 | #163 | Good $52,440 |
| Immigrants | Trinidad and Tobago | 64.7 /100 | #164 | Good $52,437 |
| Poles | 63.0 /100 | #165 | Good $52,407 |
| Immigrants | Austria | 62.6 /100 | #166 | Good $52,400 |
| Immigrants | Uganda | 61.1 /100 | #167 | Good $52,374 |
| Japanese | 60.5 /100 | #168 | Good $52,365 |
| Canadians | 58.8 /100 | #169 | Average $52,336 |
| Israelis | 58.8 /100 | #170 | Average $52,335 |
| Immigrants | Uruguay | 56.8 /100 | #171 | Average $52,302 |
| Cypriots | 51.2 /100 | #172 | Average $52,209 |
| Barbadians | 50.8 /100 | #173 | Average $52,202 |
| Immigrants | Western Asia | 50.0 /100 | #174 | Average $52,190 |
| Immigrants | Zimbabwe | 33.8 /100 | #175 | Fair $51,914 |
| Austrians | 32.9 /100 | #176 | Fair $51,898 |
| British West Indians | 30.0 /100 | #177 | Fair $51,844 |
Demographics Similar to Immigrants from Africa by Householder Income Under 25 years
In terms of householder income under 25 years, the demographic groups most similar to Immigrants from Africa are Welsh ($50,597, a difference of 0.020%), Marshallese ($50,627, a difference of 0.040%), Immigrants from Thailand ($50,645, a difference of 0.070%), Cuban ($50,655, a difference of 0.090%), and Immigrants from Bosnia and Herzegovina ($50,565, a difference of 0.090%).
| Demographics | Rating | Rank | Householder Income Under 25 years |
| Iraqis | 3.2 /100 | #238 | Tragic $50,802 |
| Immigrants | Caribbean | 2.9 /100 | #239 | Tragic $50,757 |
| Immigrants | Lebanon | 2.7 /100 | #240 | Tragic $50,729 |
| Immigrants | Micronesia | 2.5 /100 | #241 | Tragic $50,691 |
| Cubans | 2.3 /100 | #242 | Tragic $50,655 |
| Immigrants | Thailand | 2.2 /100 | #243 | Tragic $50,645 |
| Marshallese | 2.1 /100 | #244 | Tragic $50,627 |
| Immigrants | Africa | 2.0 /100 | #245 | Tragic $50,609 |
| Welsh | 2.0 /100 | #246 | Tragic $50,597 |
| Immigrants | Bosnia and Herzegovina | 1.8 /100 | #247 | Tragic $50,565 |
| Slavs | 1.8 /100 | #248 | Tragic $50,563 |
| Scottish | 1.8 /100 | #249 | Tragic $50,554 |
| Immigrants | Cabo Verde | 1.7 /100 | #250 | Tragic $50,520 |
| Celtics | 1.4 /100 | #251 | Tragic $50,447 |
| Immigrants | Mexico | 1.3 /100 | #252 | Tragic $50,422 |