Immigrants from Southern Europe vs Immigrants from Japan In Labor Force | Age 35-44
COMPARE
Immigrants from Southern Europe
Immigrants from Japan
In Labor Force | Age 35-44
In Labor Force | Age 35-44 Comparison
Immigrants from Southern Europe
Immigrants from Japan
84.8%
IN LABOR FORCE | AGE 35-44
95.3/ 100
METRIC RATING
102nd/ 347
METRIC RANK
84.6%
IN LABOR FORCE | AGE 35-44
81.4/ 100
METRIC RATING
140th/ 347
METRIC RANK
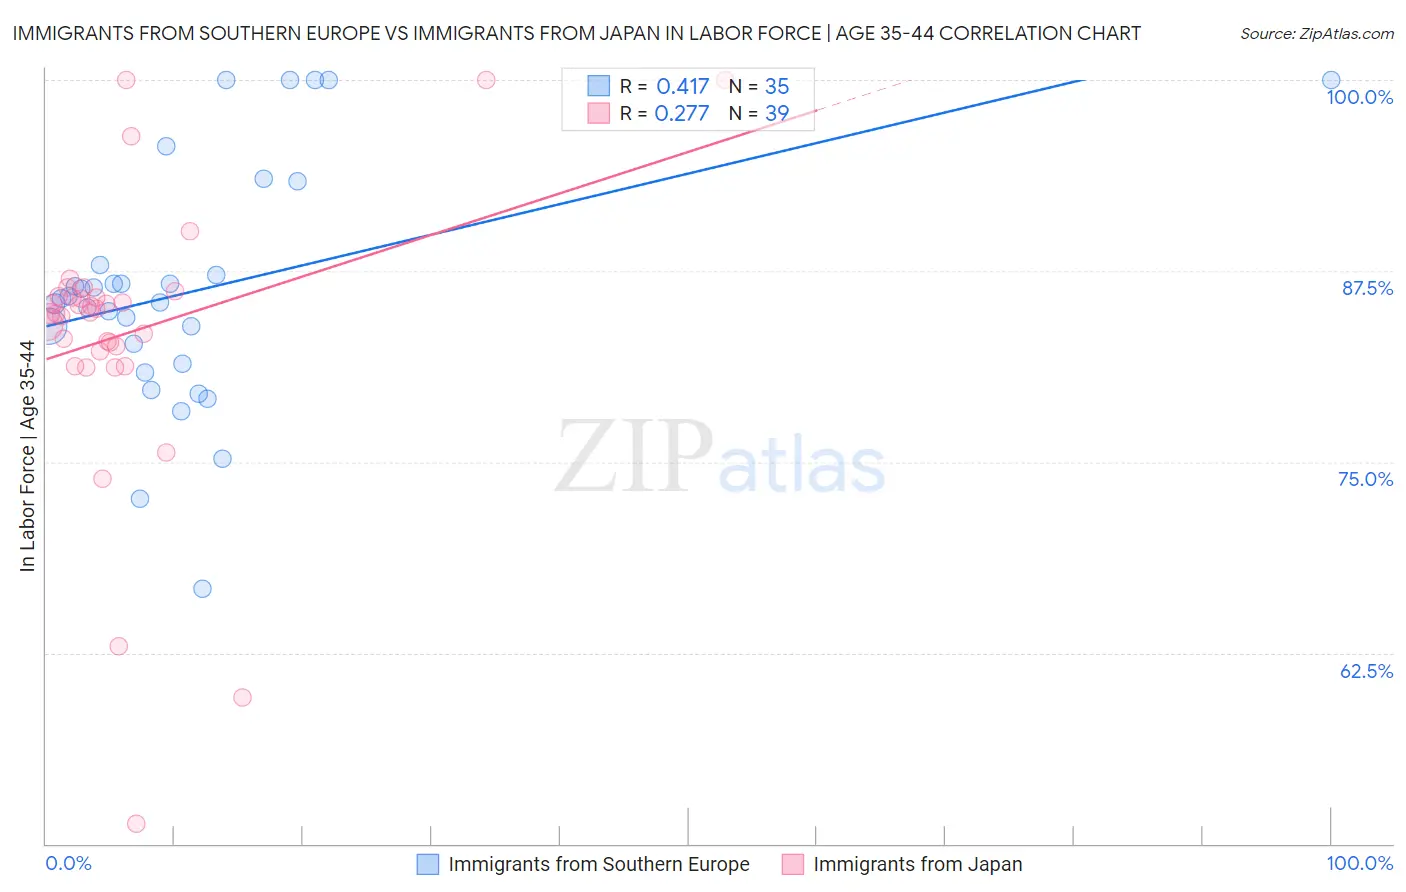
Immigrants from Southern Europe vs Immigrants from Japan In Labor Force | Age 35-44 Correlation Chart
The statistical analysis conducted on geographies consisting of 402,651,691 people shows a moderate positive correlation between the proportion of Immigrants from Southern Europe and labor force participation rate among population between the ages 35 and 44 in the United States with a correlation coefficient (R) of 0.417 and weighted average of 84.8%. Similarly, the statistical analysis conducted on geographies consisting of 340,027,391 people shows a weak positive correlation between the proportion of Immigrants from Japan and labor force participation rate among population between the ages 35 and 44 in the United States with a correlation coefficient (R) of 0.277 and weighted average of 84.6%, a difference of 0.25%.
In Labor Force | Age 35-44 Correlation Summary
| Measurement | Immigrants from Southern Europe | Immigrants from Japan |
| Minimum | 66.7% | 51.3% |
| Maximum | 100.0% | 100.0% |
| Range | 33.3% | 48.7% |
| Mean | 86.2% | 83.5% |
| Median | 85.7% | 84.7% |
| Interquartile 25% (IQ1) | 81.4% | 82.3% |
| Interquartile 75% (IQ3) | 87.9% | 85.9% |
| Interquartile Range (IQR) | 6.5% | 3.6% |
| Standard Deviation (Sample) | 7.9% | 9.3% |
| Standard Deviation (Population) | 7.8% | 9.2% |
Similar Demographics by In Labor Force | Age 35-44
Demographics Similar to Immigrants from Southern Europe by In Labor Force | Age 35-44
In terms of in labor force | age 35-44, the demographic groups most similar to Immigrants from Southern Europe are Immigrants from Belarus (84.8%, a difference of 0.0%), Immigrants from Sweden (84.8%, a difference of 0.0%), Immigrants from Australia (84.8%, a difference of 0.010%), South American (84.8%, a difference of 0.010%), and Haitian (84.8%, a difference of 0.020%).
| Demographics | Rating | Rank | In Labor Force | Age 35-44 |
| Immigrants | Kuwait | 96.7 /100 | #95 | Exceptional 84.8% |
| Cubans | 96.6 /100 | #96 | Exceptional 84.8% |
| Egyptians | 96.6 /100 | #97 | Exceptional 84.8% |
| Indians (Asian) | 96.1 /100 | #98 | Exceptional 84.8% |
| Haitians | 96.0 /100 | #99 | Exceptional 84.8% |
| Immigrants | Czechoslovakia | 95.9 /100 | #100 | Exceptional 84.8% |
| Immigrants | Australia | 95.5 /100 | #101 | Exceptional 84.8% |
| Immigrants | Southern Europe | 95.3 /100 | #102 | Exceptional 84.8% |
| Immigrants | Belarus | 95.3 /100 | #103 | Exceptional 84.8% |
| Immigrants | Sweden | 95.2 /100 | #104 | Exceptional 84.8% |
| South Americans | 95.0 /100 | #105 | Exceptional 84.8% |
| Immigrants | Bahamas | 94.8 /100 | #106 | Exceptional 84.8% |
| Immigrants | Romania | 94.7 /100 | #107 | Exceptional 84.8% |
| Immigrants | Argentina | 94.5 /100 | #108 | Exceptional 84.8% |
| Immigrants | Russia | 94.5 /100 | #109 | Exceptional 84.8% |
Demographics Similar to Immigrants from Japan by In Labor Force | Age 35-44
In terms of in labor force | age 35-44, the demographic groups most similar to Immigrants from Japan are Czechoslovakian (84.6%, a difference of 0.010%), Immigrants from Zaire (84.6%, a difference of 0.010%), Immigrants from Belgium (84.6%, a difference of 0.010%), Immigrants from Uruguay (84.6%, a difference of 0.010%), and Immigrants from Ukraine (84.6%, a difference of 0.020%).
| Demographics | Rating | Rank | In Labor Force | Age 35-44 |
| Argentineans | 88.4 /100 | #133 | Excellent 84.6% |
| Immigrants | Korea | 88.2 /100 | #134 | Excellent 84.6% |
| Immigrants | Malaysia | 87.5 /100 | #135 | Excellent 84.6% |
| Afghans | 86.3 /100 | #136 | Excellent 84.6% |
| Immigrants | Chile | 84.6 /100 | #137 | Excellent 84.6% |
| Czechoslovakians | 82.6 /100 | #138 | Excellent 84.6% |
| Immigrants | Zaire | 82.5 /100 | #139 | Excellent 84.6% |
| Immigrants | Japan | 81.4 /100 | #140 | Excellent 84.6% |
| Immigrants | Belgium | 80.8 /100 | #141 | Excellent 84.6% |
| Immigrants | Uruguay | 80.1 /100 | #142 | Excellent 84.6% |
| Immigrants | Ukraine | 79.7 /100 | #143 | Good 84.6% |
| Immigrants | Jamaica | 79.4 /100 | #144 | Good 84.6% |
| Immigrants | Saudi Arabia | 79.4 /100 | #145 | Good 84.6% |
| Immigrants | Asia | 78.7 /100 | #146 | Good 84.5% |
| Immigrants | Netherlands | 76.6 /100 | #147 | Good 84.5% |