Cypriot vs Immigrants from Japan In Labor Force | Age 35-44
COMPARE
Cypriot
Immigrants from Japan
In Labor Force | Age 35-44
In Labor Force | Age 35-44 Comparison
Cypriots
Immigrants from Japan
85.2%
IN LABOR FORCE | AGE 35-44
99.8/ 100
METRIC RATING
45th/ 347
METRIC RANK
84.6%
IN LABOR FORCE | AGE 35-44
81.4/ 100
METRIC RATING
140th/ 347
METRIC RANK
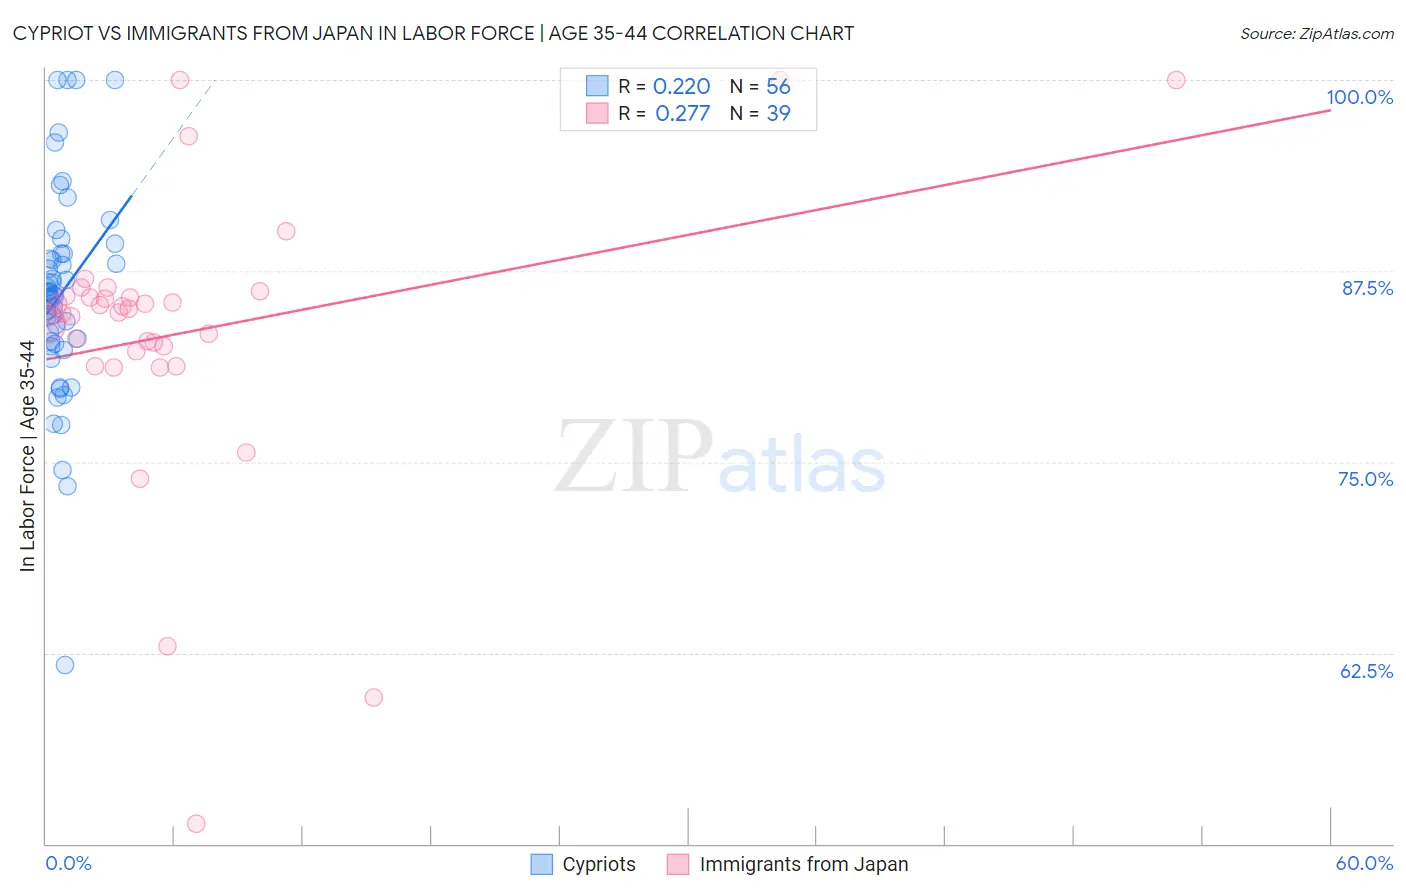
Cypriot vs Immigrants from Japan In Labor Force | Age 35-44 Correlation Chart
The statistical analysis conducted on geographies consisting of 61,851,506 people shows a weak positive correlation between the proportion of Cypriots and labor force participation rate among population between the ages 35 and 44 in the United States with a correlation coefficient (R) of 0.220 and weighted average of 85.2%. Similarly, the statistical analysis conducted on geographies consisting of 340,027,391 people shows a weak positive correlation between the proportion of Immigrants from Japan and labor force participation rate among population between the ages 35 and 44 in the United States with a correlation coefficient (R) of 0.277 and weighted average of 84.6%, a difference of 0.74%.
In Labor Force | Age 35-44 Correlation Summary
| Measurement | Cypriot | Immigrants from Japan |
| Minimum | 61.7% | 51.3% |
| Maximum | 100.0% | 100.0% |
| Range | 38.3% | 48.7% |
| Mean | 86.0% | 83.5% |
| Median | 86.0% | 84.7% |
| Interquartile 25% (IQ1) | 82.8% | 82.3% |
| Interquartile 75% (IQ3) | 88.6% | 85.9% |
| Interquartile Range (IQR) | 5.8% | 3.6% |
| Standard Deviation (Sample) | 6.8% | 9.3% |
| Standard Deviation (Population) | 6.8% | 9.2% |
Similar Demographics by In Labor Force | Age 35-44
Demographics Similar to Cypriots by In Labor Force | Age 35-44
In terms of in labor force | age 35-44, the demographic groups most similar to Cypriots are Immigrants from Hong Kong (85.2%, a difference of 0.0%), Lithuanian (85.2%, a difference of 0.010%), German Russian (85.2%, a difference of 0.010%), Immigrants from Zimbabwe (85.2%, a difference of 0.020%), and Macedonian (85.2%, a difference of 0.020%).
| Demographics | Rating | Rank | In Labor Force | Age 35-44 |
| Immigrants | Poland | 99.8 /100 | #38 | Exceptional 85.2% |
| Eastern Europeans | 99.8 /100 | #39 | Exceptional 85.2% |
| Immigrants | Bulgaria | 99.8 /100 | #40 | Exceptional 85.2% |
| Immigrants | Zimbabwe | 99.8 /100 | #41 | Exceptional 85.2% |
| Macedonians | 99.8 /100 | #42 | Exceptional 85.2% |
| Poles | 99.8 /100 | #43 | Exceptional 85.2% |
| Lithuanians | 99.8 /100 | #44 | Exceptional 85.2% |
| Cypriots | 99.8 /100 | #45 | Exceptional 85.2% |
| Immigrants | Hong Kong | 99.8 /100 | #46 | Exceptional 85.2% |
| German Russians | 99.8 /100 | #47 | Exceptional 85.2% |
| Immigrants | Eritrea | 99.7 /100 | #48 | Exceptional 85.2% |
| Croatians | 99.7 /100 | #49 | Exceptional 85.2% |
| Thais | 99.7 /100 | #50 | Exceptional 85.2% |
| Immigrants | Albania | 99.7 /100 | #51 | Exceptional 85.1% |
| Immigrants | Kenya | 99.6 /100 | #52 | Exceptional 85.1% |
Demographics Similar to Immigrants from Japan by In Labor Force | Age 35-44
In terms of in labor force | age 35-44, the demographic groups most similar to Immigrants from Japan are Czechoslovakian (84.6%, a difference of 0.010%), Immigrants from Zaire (84.6%, a difference of 0.010%), Immigrants from Belgium (84.6%, a difference of 0.010%), Immigrants from Uruguay (84.6%, a difference of 0.010%), and Immigrants from Ukraine (84.6%, a difference of 0.020%).
| Demographics | Rating | Rank | In Labor Force | Age 35-44 |
| Argentineans | 88.4 /100 | #133 | Excellent 84.6% |
| Immigrants | Korea | 88.2 /100 | #134 | Excellent 84.6% |
| Immigrants | Malaysia | 87.5 /100 | #135 | Excellent 84.6% |
| Afghans | 86.3 /100 | #136 | Excellent 84.6% |
| Immigrants | Chile | 84.6 /100 | #137 | Excellent 84.6% |
| Czechoslovakians | 82.6 /100 | #138 | Excellent 84.6% |
| Immigrants | Zaire | 82.5 /100 | #139 | Excellent 84.6% |
| Immigrants | Japan | 81.4 /100 | #140 | Excellent 84.6% |
| Immigrants | Belgium | 80.8 /100 | #141 | Excellent 84.6% |
| Immigrants | Uruguay | 80.1 /100 | #142 | Excellent 84.6% |
| Immigrants | Ukraine | 79.7 /100 | #143 | Good 84.6% |
| Immigrants | Jamaica | 79.4 /100 | #144 | Good 84.6% |
| Immigrants | Saudi Arabia | 79.4 /100 | #145 | Good 84.6% |
| Immigrants | Asia | 78.7 /100 | #146 | Good 84.5% |
| Immigrants | Netherlands | 76.6 /100 | #147 | Good 84.5% |