Iroquois vs Immigrants from Belgium In Labor Force | Age 16-19
COMPARE
Iroquois
Immigrants from Belgium
In Labor Force | Age 16-19
In Labor Force | Age 16-19 Comparison
Iroquois
Immigrants from Belgium
39.9%
IN LABOR FORCE | AGE 16-19
99.9/ 100
METRIC RATING
72nd/ 347
METRIC RANK
35.3%
IN LABOR FORCE | AGE 16-19
6.1/ 100
METRIC RATING
225th/ 347
METRIC RANK
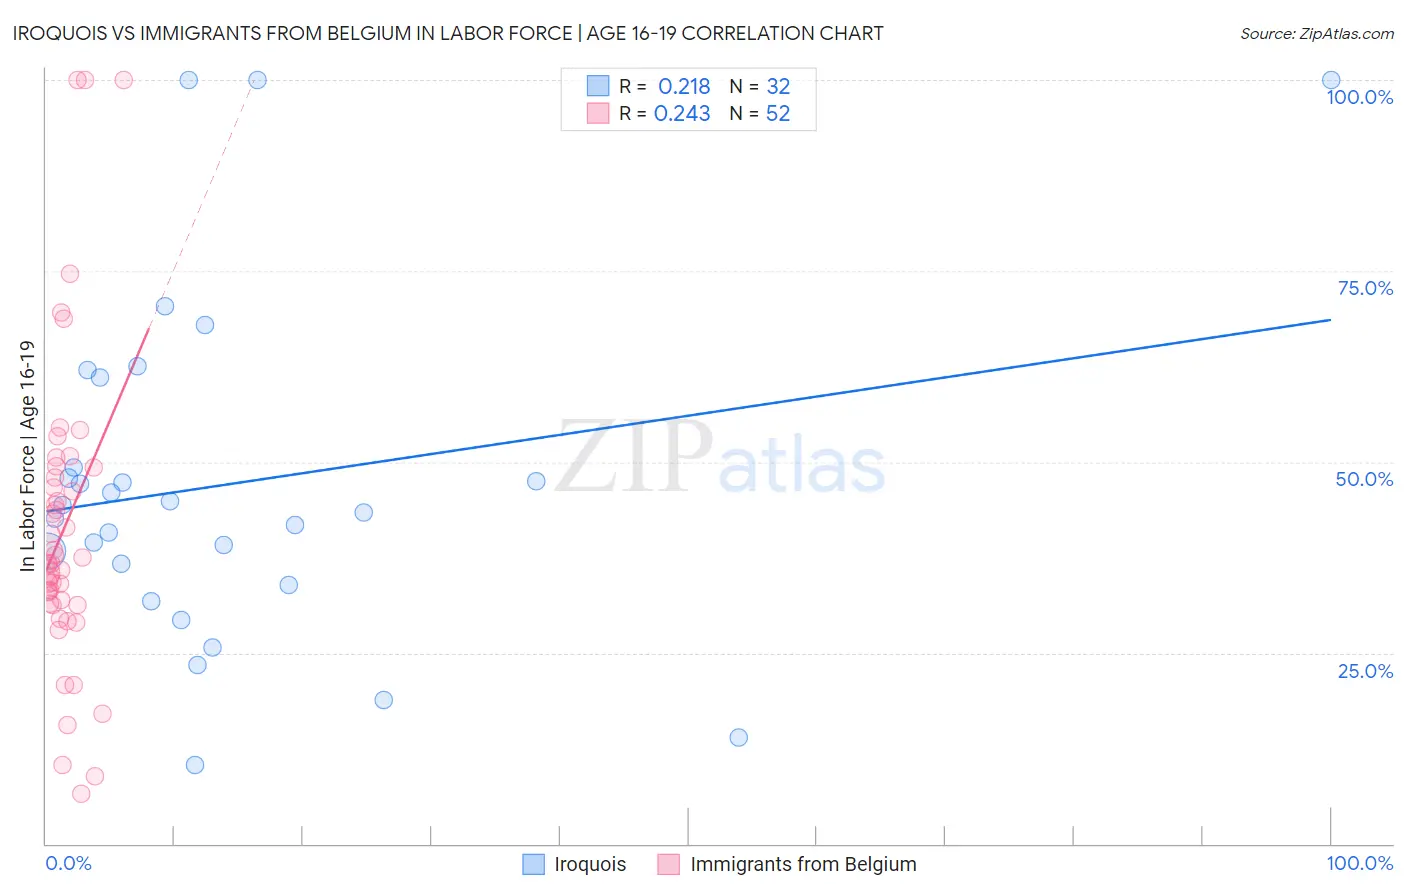
Iroquois vs Immigrants from Belgium In Labor Force | Age 16-19 Correlation Chart
The statistical analysis conducted on geographies consisting of 207,097,008 people shows a weak positive correlation between the proportion of Iroquois and labor force participation rate among population between the ages 16 and 19 in the United States with a correlation coefficient (R) of 0.218 and weighted average of 39.9%. Similarly, the statistical analysis conducted on geographies consisting of 146,618,217 people shows a weak positive correlation between the proportion of Immigrants from Belgium and labor force participation rate among population between the ages 16 and 19 in the United States with a correlation coefficient (R) of 0.243 and weighted average of 35.3%, a difference of 13.1%.
In Labor Force | Age 16-19 Correlation Summary
| Measurement | Iroquois | Immigrants from Belgium |
| Minimum | 10.4% | 6.6% |
| Maximum | 100.0% | 100.0% |
| Range | 89.6% | 93.4% |
| Mean | 47.1% | 41.3% |
| Median | 43.8% | 36.7% |
| Interquartile 25% (IQ1) | 35.2% | 31.4% |
| Interquartile 75% (IQ3) | 55.2% | 48.6% |
| Interquartile Range (IQR) | 19.9% | 17.2% |
| Standard Deviation (Sample) | 22.3% | 20.2% |
| Standard Deviation (Population) | 22.0% | 20.0% |
Similar Demographics by In Labor Force | Age 16-19
Demographics Similar to Iroquois by In Labor Force | Age 16-19
In terms of in labor force | age 16-19, the demographic groups most similar to Iroquois are Serbian (39.9%, a difference of 0.010%), Immigrants from Middle Africa (39.9%, a difference of 0.030%), Portuguese (40.0%, a difference of 0.17%), Potawatomi (40.0%, a difference of 0.22%), and Hungarian (39.8%, a difference of 0.26%).
| Demographics | Rating | Rank | In Labor Force | Age 16-19 |
| Kenyans | 100.0 /100 | #65 | Exceptional 40.1% |
| Immigrants | Nonimmigrants | 100.0 /100 | #66 | Exceptional 40.1% |
| Canadians | 100.0 /100 | #67 | Exceptional 40.1% |
| Italians | 99.9 /100 | #68 | Exceptional 40.1% |
| Potawatomi | 99.9 /100 | #69 | Exceptional 40.0% |
| Portuguese | 99.9 /100 | #70 | Exceptional 40.0% |
| Serbians | 99.9 /100 | #71 | Exceptional 39.9% |
| Iroquois | 99.9 /100 | #72 | Exceptional 39.9% |
| Immigrants | Middle Africa | 99.9 /100 | #73 | Exceptional 39.9% |
| Hungarians | 99.9 /100 | #74 | Exceptional 39.8% |
| French American Indians | 99.9 /100 | #75 | Exceptional 39.8% |
| Malaysians | 99.9 /100 | #76 | Exceptional 39.7% |
| Immigrants | Portugal | 99.9 /100 | #77 | Exceptional 39.7% |
| Austrians | 99.8 /100 | #78 | Exceptional 39.5% |
| Marshallese | 99.8 /100 | #79 | Exceptional 39.5% |
Demographics Similar to Immigrants from Belgium by In Labor Force | Age 16-19
In terms of in labor force | age 16-19, the demographic groups most similar to Immigrants from Belgium are Honduran (35.3%, a difference of 0.080%), Ghanaian (35.3%, a difference of 0.090%), Immigrants from Guatemala (35.3%, a difference of 0.090%), Mongolian (35.3%, a difference of 0.10%), and Immigrants from Senegal (35.3%, a difference of 0.15%).
| Demographics | Rating | Rank | In Labor Force | Age 16-19 |
| Sri Lankans | 9.8 /100 | #218 | Tragic 35.5% |
| Guatemalans | 8.6 /100 | #219 | Tragic 35.5% |
| Immigrants | Bahamas | 8.3 /100 | #220 | Tragic 35.5% |
| Turks | 7.3 /100 | #221 | Tragic 35.4% |
| Immigrants | Ghana | 7.3 /100 | #222 | Tragic 35.4% |
| Ghanaians | 6.5 /100 | #223 | Tragic 35.3% |
| Hondurans | 6.5 /100 | #224 | Tragic 35.3% |
| Immigrants | Belgium | 6.1 /100 | #225 | Tragic 35.3% |
| Immigrants | Guatemala | 5.7 /100 | #226 | Tragic 35.3% |
| Mongolians | 5.7 /100 | #227 | Tragic 35.3% |
| Immigrants | Senegal | 5.5 /100 | #228 | Tragic 35.3% |
| Immigrants | Lebanon | 5.0 /100 | #229 | Tragic 35.2% |
| Immigrants | Honduras | 4.9 /100 | #230 | Tragic 35.2% |
| Immigrants | Syria | 4.5 /100 | #231 | Tragic 35.2% |
| Immigrants | Kazakhstan | 4.5 /100 | #232 | Tragic 35.2% |