Iroquois vs Basque Householder Income Under 25 years
COMPARE
Iroquois
Basque
Householder Income Under 25 years
Householder Income Under 25 years Comparison
Iroquois
Basques
$47,380
HOUSEHOLDER INCOME UNDER 25 YEARS
0.0/ 100
METRIC RATING
310th/ 347
METRIC RANK
$51,818
HOUSEHOLDER INCOME UNDER 25 YEARS
28.7/ 100
METRIC RATING
179th/ 347
METRIC RANK
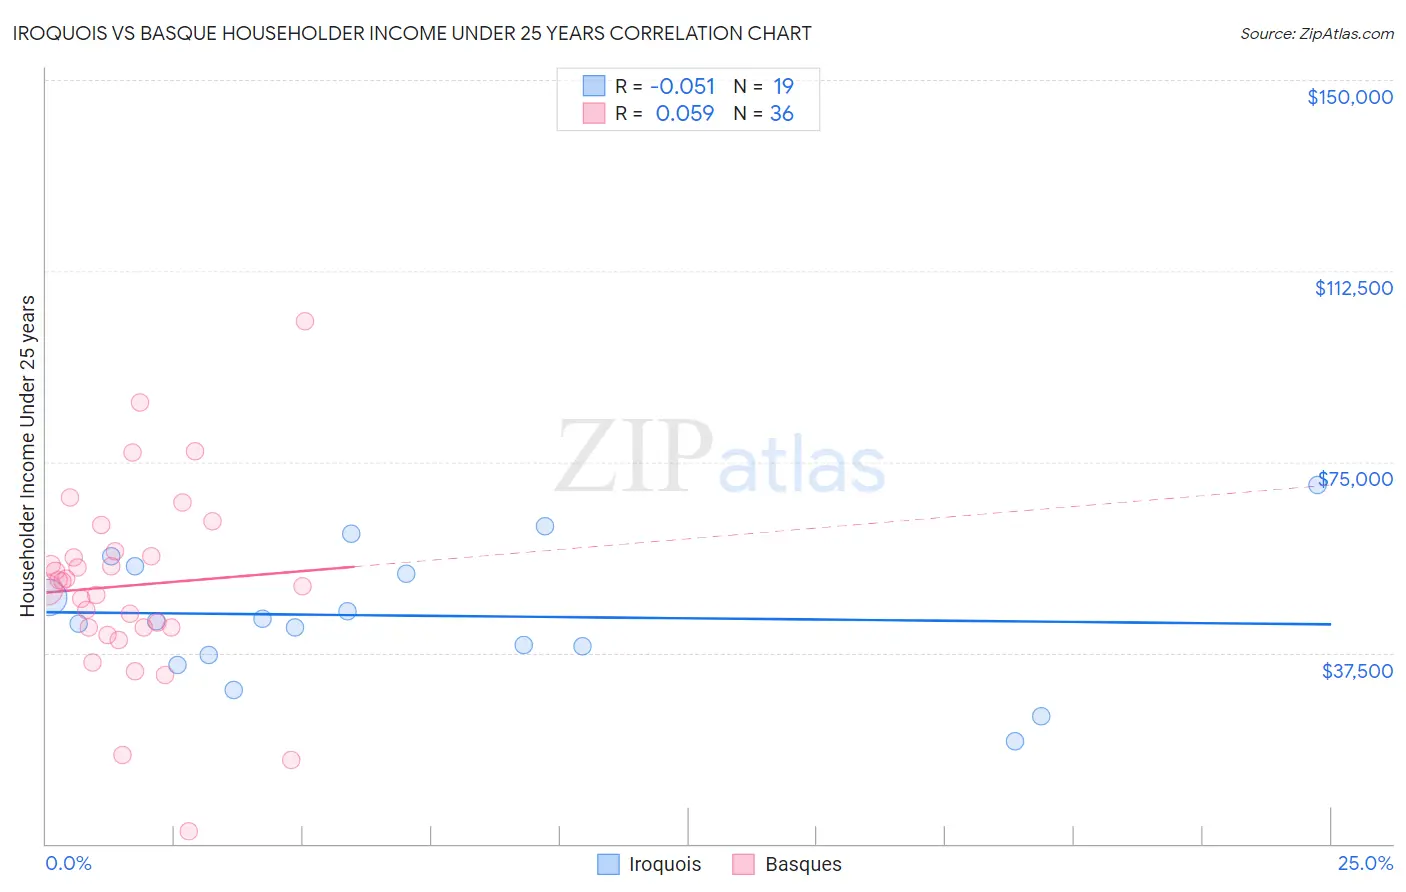
Iroquois vs Basque Householder Income Under 25 years Correlation Chart
The statistical analysis conducted on geographies consisting of 187,377,490 people shows a slight negative correlation between the proportion of Iroquois and household income with householder under the age of 25 in the United States with a correlation coefficient (R) of -0.051 and weighted average of $47,380. Similarly, the statistical analysis conducted on geographies consisting of 150,470,648 people shows a slight positive correlation between the proportion of Basques and household income with householder under the age of 25 in the United States with a correlation coefficient (R) of 0.059 and weighted average of $51,818, a difference of 9.4%.
Householder Income Under 25 years Correlation Summary
| Measurement | Iroquois | Basque |
| Minimum | $20,250 | $2,499 |
| Maximum | $70,577 | $102,571 |
| Range | $50,327 | $100,072 |
| Mean | $44,802 | $50,731 |
| Median | $43,754 | $51,007 |
| Interquartile 25% (IQ1) | $37,131 | $42,540 |
| Interquartile 75% (IQ3) | $54,399 | $57,010 |
| Interquartile Range (IQR) | $17,268 | $14,470 |
| Standard Deviation (Sample) | $12,869 | $18,783 |
| Standard Deviation (Population) | $12,525 | $18,521 |
Similar Demographics by Householder Income Under 25 years
Demographics Similar to Iroquois by Householder Income Under 25 years
In terms of householder income under 25 years, the demographic groups most similar to Iroquois are Ottawa ($47,366, a difference of 0.030%), Bermudan ($47,359, a difference of 0.040%), U.S. Virgin Islander ($47,448, a difference of 0.14%), Comanche ($47,518, a difference of 0.29%), and Bangladeshi ($47,589, a difference of 0.44%).
| Demographics | Rating | Rank | Householder Income Under 25 years |
| Immigrants | Middle Africa | 0.0 /100 | #303 | Tragic $47,916 |
| Menominee | 0.0 /100 | #304 | Tragic $47,907 |
| Cherokee | 0.0 /100 | #305 | Tragic $47,848 |
| Natives/Alaskans | 0.0 /100 | #306 | Tragic $47,704 |
| Bangladeshis | 0.0 /100 | #307 | Tragic $47,589 |
| Comanche | 0.0 /100 | #308 | Tragic $47,518 |
| U.S. Virgin Islanders | 0.0 /100 | #309 | Tragic $47,448 |
| Iroquois | 0.0 /100 | #310 | Tragic $47,380 |
| Ottawa | 0.0 /100 | #311 | Tragic $47,366 |
| Bermudans | 0.0 /100 | #312 | Tragic $47,359 |
| Delaware | 0.0 /100 | #313 | Tragic $47,159 |
| Chippewa | 0.0 /100 | #314 | Tragic $47,015 |
| Crow | 0.0 /100 | #315 | Tragic $47,012 |
| Sudanese | 0.0 /100 | #316 | Tragic $46,982 |
| Hopi | 0.0 /100 | #317 | Tragic $46,978 |
Demographics Similar to Basques by Householder Income Under 25 years
In terms of householder income under 25 years, the demographic groups most similar to Basques are Immigrants from England ($51,817, a difference of 0.0%), Finnish ($51,827, a difference of 0.020%), European ($51,796, a difference of 0.040%), Jordanian ($51,796, a difference of 0.040%), and British West Indian ($51,844, a difference of 0.050%).
| Demographics | Rating | Rank | Householder Income Under 25 years |
| Cypriots | 51.2 /100 | #172 | Average $52,209 |
| Barbadians | 50.8 /100 | #173 | Average $52,202 |
| Immigrants | Western Asia | 50.0 /100 | #174 | Average $52,190 |
| Immigrants | Zimbabwe | 33.8 /100 | #175 | Fair $51,914 |
| Austrians | 32.9 /100 | #176 | Fair $51,898 |
| British West Indians | 30.0 /100 | #177 | Fair $51,844 |
| Finns | 29.2 /100 | #178 | Fair $51,827 |
| Basques | 28.7 /100 | #179 | Fair $51,818 |
| Immigrants | England | 28.7 /100 | #180 | Fair $51,817 |
| Europeans | 27.6 /100 | #181 | Fair $51,796 |
| Jordanians | 27.6 /100 | #182 | Fair $51,796 |
| Mexican American Indians | 27.0 /100 | #183 | Fair $51,783 |
| Paiute | 25.1 /100 | #184 | Fair $51,743 |
| Immigrants | Latvia | 24.8 /100 | #185 | Fair $51,737 |
| Alaskan Athabascans | 23.8 /100 | #186 | Fair $51,713 |