Choctaw vs Immigrants from Sierra Leone In Labor Force | Age > 16
COMPARE
Choctaw
Immigrants from Sierra Leone
In Labor Force | Age > 16
In Labor Force | Age > 16 Comparison
Choctaw
Immigrants from Sierra Leone
61.5%
IN LABOR FORCE | AGE > 16
0.0/ 100
METRIC RATING
329th/ 347
METRIC RANK
68.5%
IN LABOR FORCE | AGE > 16
100.0/ 100
METRIC RATING
8th/ 347
METRIC RANK
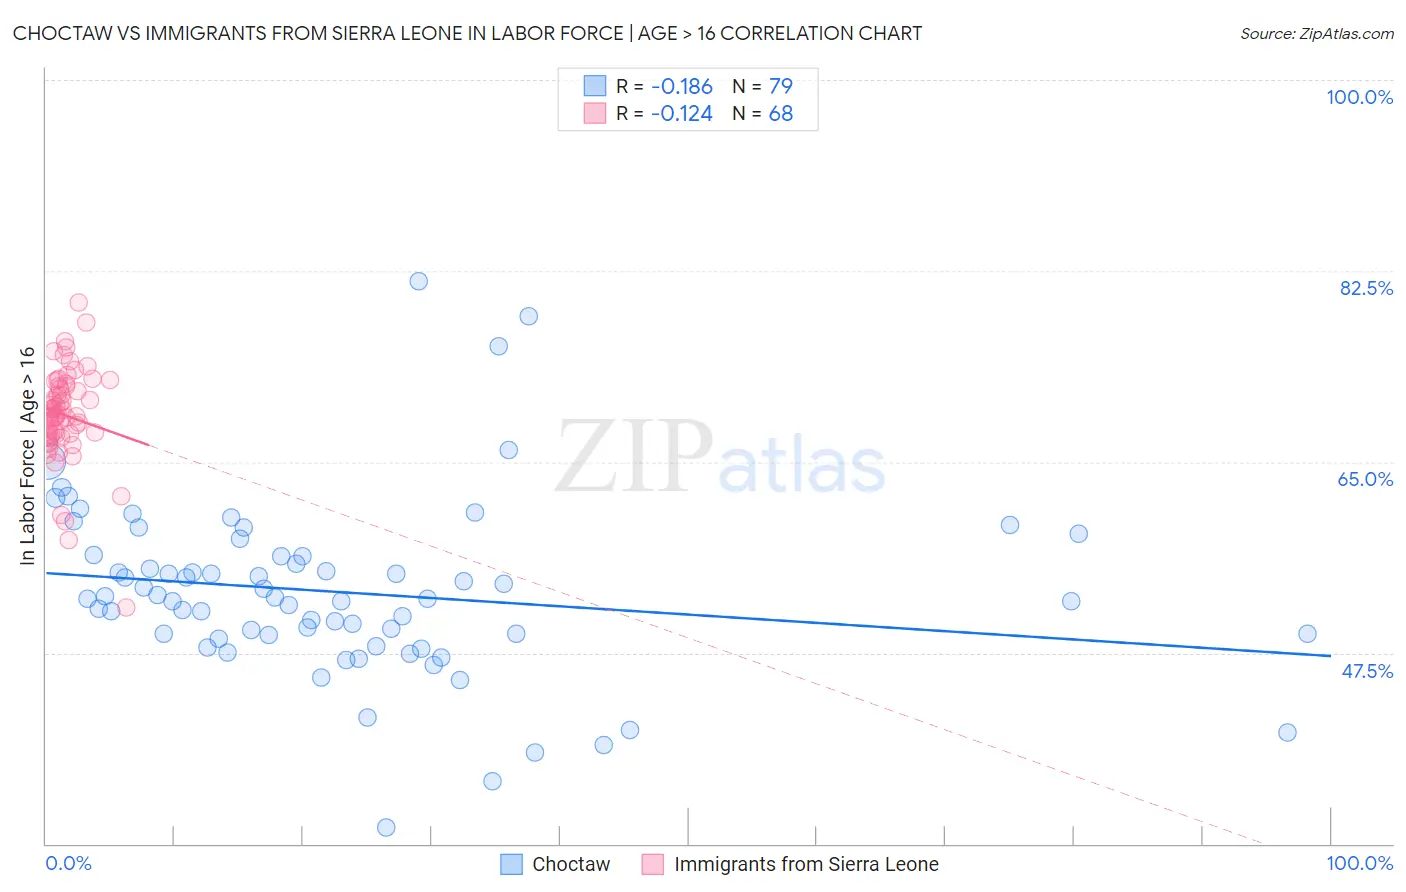
Choctaw vs Immigrants from Sierra Leone In Labor Force | Age > 16 Correlation Chart
The statistical analysis conducted on geographies consisting of 269,719,523 people shows a poor negative correlation between the proportion of Choctaw and labor force participation rate among population ages 16 and over in the United States with a correlation coefficient (R) of -0.186 and weighted average of 61.5%. Similarly, the statistical analysis conducted on geographies consisting of 101,649,709 people shows a poor negative correlation between the proportion of Immigrants from Sierra Leone and labor force participation rate among population ages 16 and over in the United States with a correlation coefficient (R) of -0.124 and weighted average of 68.5%, a difference of 11.4%.
In Labor Force | Age > 16 Correlation Summary
| Measurement | Choctaw | Immigrants from Sierra Leone |
| Minimum | 31.5% | 51.7% |
| Maximum | 81.6% | 79.6% |
| Range | 50.1% | 27.9% |
| Mean | 53.1% | 69.3% |
| Median | 52.5% | 69.3% |
| Interquartile 25% (IQ1) | 49.1% | 67.5% |
| Interquartile 75% (IQ3) | 56.4% | 71.9% |
| Interquartile Range (IQR) | 7.2% | 4.5% |
| Standard Deviation (Sample) | 8.2% | 4.4% |
| Standard Deviation (Population) | 8.1% | 4.4% |
Similar Demographics by In Labor Force | Age > 16
Demographics Similar to Choctaw by In Labor Force | Age > 16
In terms of in labor force | age > 16, the demographic groups most similar to Choctaw are Creek (61.3%, a difference of 0.22%), Dutch West Indian (61.7%, a difference of 0.36%), Cajun (61.8%, a difference of 0.52%), Sioux (61.8%, a difference of 0.63%), and Cherokee (61.9%, a difference of 0.81%).
| Demographics | Rating | Rank | In Labor Force | Age > 16 |
| Ottawa | 0.0 /100 | #322 | Tragic 62.0% |
| Seminole | 0.0 /100 | #323 | Tragic 62.0% |
| Cheyenne | 0.0 /100 | #324 | Tragic 62.0% |
| Cherokee | 0.0 /100 | #325 | Tragic 61.9% |
| Sioux | 0.0 /100 | #326 | Tragic 61.8% |
| Cajuns | 0.0 /100 | #327 | Tragic 61.8% |
| Dutch West Indians | 0.0 /100 | #328 | Tragic 61.7% |
| Choctaw | 0.0 /100 | #329 | Tragic 61.5% |
| Creek | 0.0 /100 | #330 | Tragic 61.3% |
| Ute | 0.0 /100 | #331 | Tragic 60.9% |
| Crow | 0.0 /100 | #332 | Tragic 60.8% |
| Paiute | 0.0 /100 | #333 | Tragic 60.7% |
| Apache | 0.0 /100 | #334 | Tragic 60.7% |
| Natives/Alaskans | 0.0 /100 | #335 | Tragic 60.6% |
| Menominee | 0.0 /100 | #336 | Tragic 60.6% |
Demographics Similar to Immigrants from Sierra Leone by In Labor Force | Age > 16
In terms of in labor force | age > 16, the demographic groups most similar to Immigrants from Sierra Leone are Immigrants from Eastern Africa (68.5%, a difference of 0.010%), Immigrants from Bolivia (68.4%, a difference of 0.050%), Immigrants from Cameroon (68.7%, a difference of 0.32%), Bolivian (68.2%, a difference of 0.41%), and Immigrants from Eritrea (68.9%, a difference of 0.57%).
| Demographics | Rating | Rank | In Labor Force | Age > 16 |
| Immigrants | Ethiopia | 100.0 /100 | #1 | Exceptional 69.4% |
| Ethiopians | 100.0 /100 | #2 | Exceptional 69.3% |
| Somalis | 100.0 /100 | #3 | Exceptional 69.2% |
| Immigrants | Somalia | 100.0 /100 | #4 | Exceptional 69.1% |
| Sierra Leoneans | 100.0 /100 | #5 | Exceptional 68.9% |
| Immigrants | Eritrea | 100.0 /100 | #6 | Exceptional 68.9% |
| Immigrants | Cameroon | 100.0 /100 | #7 | Exceptional 68.7% |
| Immigrants | Sierra Leone | 100.0 /100 | #8 | Exceptional 68.5% |
| Immigrants | Eastern Africa | 100.0 /100 | #9 | Exceptional 68.5% |
| Immigrants | Bolivia | 100.0 /100 | #10 | Exceptional 68.4% |
| Bolivians | 100.0 /100 | #11 | Exceptional 68.2% |
| Sudanese | 100.0 /100 | #12 | Exceptional 68.0% |
| Immigrants | Nepal | 100.0 /100 | #13 | Exceptional 68.0% |
| Liberians | 100.0 /100 | #14 | Exceptional 67.8% |
| Immigrants | Middle Africa | 100.0 /100 | #15 | Exceptional 67.7% |