Irish vs Spanish In Labor Force | Age > 16
COMPARE
Irish
Spanish
In Labor Force | Age > 16
In Labor Force | Age > 16 Comparison
Irish
Spanish
64.1%
IN LABOR FORCE | AGE > 16
0.4/ 100
METRIC RATING
269th/ 347
METRIC RANK
63.9%
IN LABOR FORCE | AGE > 16
0.1/ 100
METRIC RATING
288th/ 347
METRIC RANK
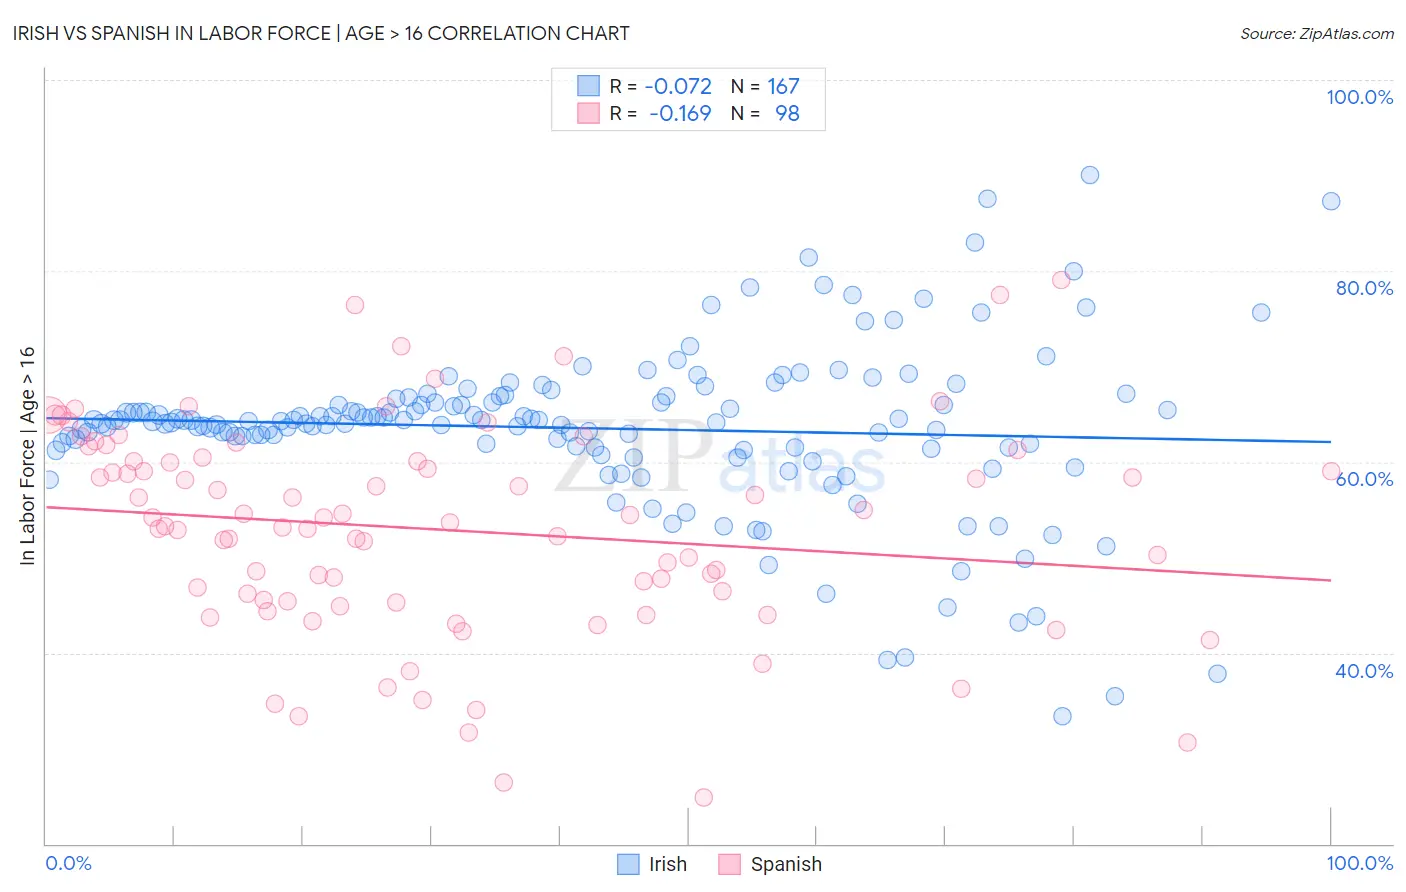
Irish vs Spanish In Labor Force | Age > 16 Correlation Chart
The statistical analysis conducted on geographies consisting of 580,699,794 people shows a slight negative correlation between the proportion of Irish and labor force participation rate among population ages 16 and over in the United States with a correlation coefficient (R) of -0.072 and weighted average of 64.1%. Similarly, the statistical analysis conducted on geographies consisting of 422,185,482 people shows a poor negative correlation between the proportion of Spanish and labor force participation rate among population ages 16 and over in the United States with a correlation coefficient (R) of -0.169 and weighted average of 63.9%, a difference of 0.42%.
In Labor Force | Age > 16 Correlation Summary
| Measurement | Irish | Spanish |
| Minimum | 33.3% | 24.8% |
| Maximum | 90.0% | 79.0% |
| Range | 56.7% | 54.2% |
| Mean | 63.5% | 52.9% |
| Median | 64.3% | 53.5% |
| Interquartile 25% (IQ1) | 61.5% | 45.4% |
| Interquartile 75% (IQ3) | 66.6% | 60.1% |
| Interquartile Range (IQR) | 5.1% | 14.7% |
| Standard Deviation (Sample) | 8.6% | 11.0% |
| Standard Deviation (Population) | 8.6% | 11.0% |
Demographics Similar to Irish and Spanish by In Labor Force | Age > 16
In terms of in labor force | age > 16, the demographic groups most similar to Irish are Guyanese (64.1%, a difference of 0.030%), Dominican (64.1%, a difference of 0.030%), Spaniard (64.1%, a difference of 0.040%), Native Hawaiian (64.1%, a difference of 0.060%), and Hmong (64.1%, a difference of 0.060%). Similarly, the demographic groups most similar to Spanish are Immigrants from Austria (63.9%, a difference of 0.050%), Scottish (63.9%, a difference of 0.050%), Slovak (63.9%, a difference of 0.070%), French (63.9%, a difference of 0.10%), and Immigrants from Germany (63.9%, a difference of 0.12%).
| Demographics | Rating | Rank | In Labor Force | Age > 16 |
| Spaniards | 0.5 /100 | #268 | Tragic 64.1% |
| Irish | 0.4 /100 | #269 | Tragic 64.1% |
| Guyanese | 0.4 /100 | #270 | Tragic 64.1% |
| Dominicans | 0.4 /100 | #271 | Tragic 64.1% |
| Native Hawaiians | 0.3 /100 | #272 | Tragic 64.1% |
| Hmong | 0.3 /100 | #273 | Tragic 64.1% |
| Immigrants | Cuba | 0.3 /100 | #274 | Tragic 64.1% |
| Mexicans | 0.3 /100 | #275 | Tragic 64.1% |
| French American Indians | 0.3 /100 | #276 | Tragic 64.1% |
| Immigrants | Bahamas | 0.3 /100 | #277 | Tragic 64.0% |
| Assyrians/Chaldeans/Syriacs | 0.3 /100 | #278 | Tragic 64.0% |
| Welsh | 0.2 /100 | #279 | Tragic 64.0% |
| Immigrants | St. Vincent and the Grenadines | 0.2 /100 | #280 | Tragic 64.0% |
| French Canadians | 0.2 /100 | #281 | Tragic 64.0% |
| Immigrants | Guyana | 0.2 /100 | #282 | Tragic 64.0% |
| Immigrants | Germany | 0.1 /100 | #283 | Tragic 63.9% |
| French | 0.1 /100 | #284 | Tragic 63.9% |
| Slovaks | 0.1 /100 | #285 | Tragic 63.9% |
| Immigrants | Austria | 0.1 /100 | #286 | Tragic 63.9% |
| Scottish | 0.1 /100 | #287 | Tragic 63.9% |
| Spanish | 0.1 /100 | #288 | Tragic 63.9% |