Irish vs Immigrants from Ecuador In Labor Force | Age 45-54
COMPARE
Irish
Immigrants from Ecuador
In Labor Force | Age 45-54
In Labor Force | Age 45-54 Comparison
Irish
Immigrants from Ecuador
82.6%
IN LABOR FORCE | AGE 45-54
29.2/ 100
METRIC RATING
186th/ 347
METRIC RANK
82.2%
IN LABOR FORCE | AGE 45-54
3.4/ 100
METRIC RATING
222nd/ 347
METRIC RANK
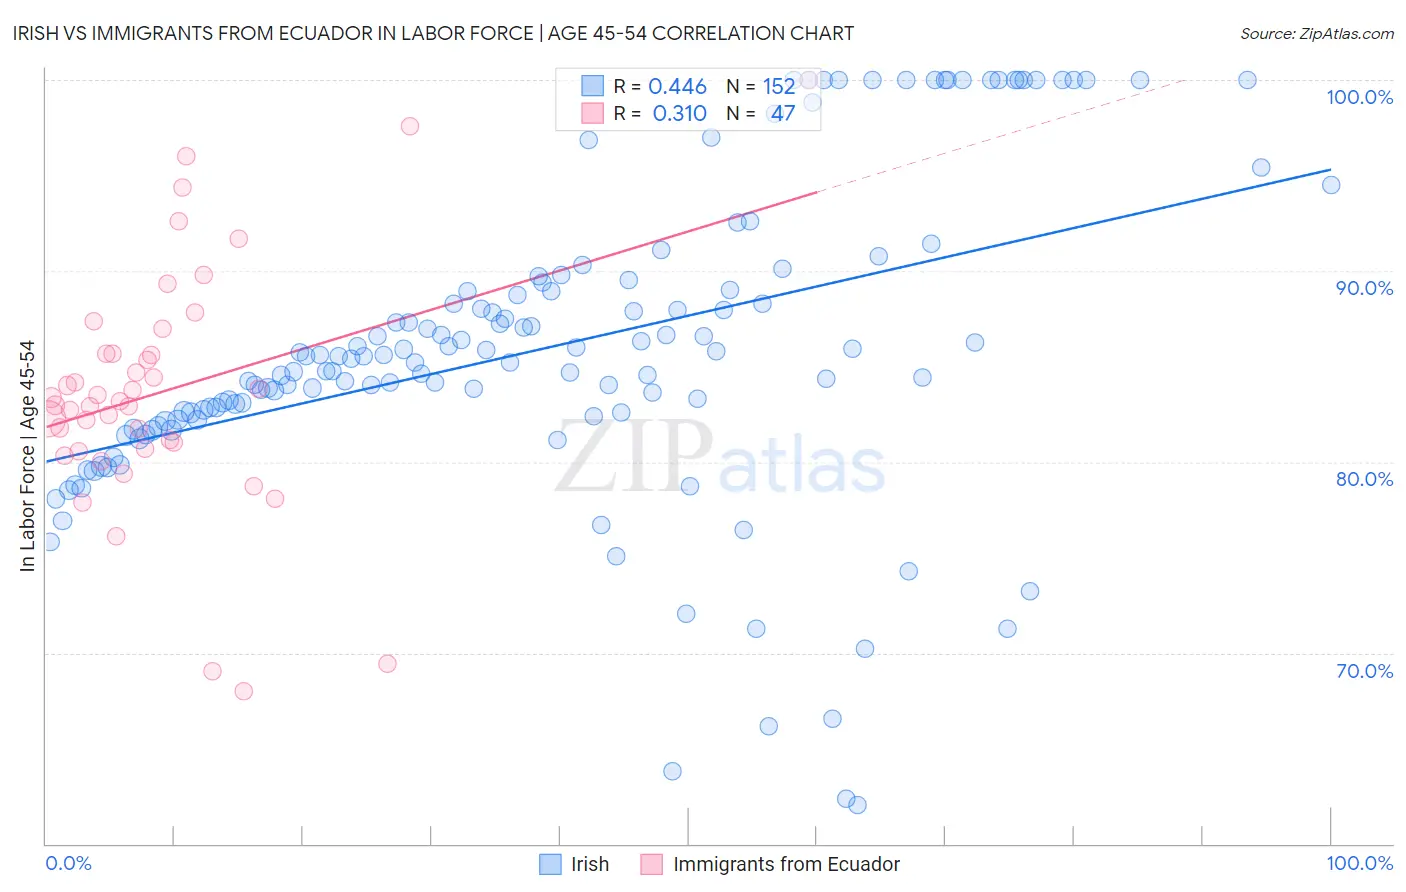
Irish vs Immigrants from Ecuador In Labor Force | Age 45-54 Correlation Chart
The statistical analysis conducted on geographies consisting of 579,633,404 people shows a moderate positive correlation between the proportion of Irish and labor force participation rate among population between the ages 45 and 54 in the United States with a correlation coefficient (R) of 0.446 and weighted average of 82.6%. Similarly, the statistical analysis conducted on geographies consisting of 270,878,287 people shows a mild positive correlation between the proportion of Immigrants from Ecuador and labor force participation rate among population between the ages 45 and 54 in the United States with a correlation coefficient (R) of 0.310 and weighted average of 82.2%, a difference of 0.54%.
In Labor Force | Age 45-54 Correlation Summary
| Measurement | Irish | Immigrants from Ecuador |
| Minimum | 62.0% | 68.0% |
| Maximum | 100.0% | 100.0% |
| Range | 38.0% | 32.0% |
| Mean | 86.0% | 83.7% |
| Median | 85.5% | 83.2% |
| Interquartile 25% (IQ1) | 82.3% | 80.7% |
| Interquartile 75% (IQ3) | 89.2% | 85.7% |
| Interquartile Range (IQR) | 6.9% | 5.0% |
| Standard Deviation (Sample) | 8.2% | 6.4% |
| Standard Deviation (Population) | 8.2% | 6.4% |
Similar Demographics by In Labor Force | Age 45-54
Demographics Similar to Irish by In Labor Force | Age 45-54
In terms of in labor force | age 45-54, the demographic groups most similar to Irish are Immigrants from Costa Rica (82.6%, a difference of 0.010%), South African (82.6%, a difference of 0.010%), Immigrants from England (82.6%, a difference of 0.030%), Syrian (82.6%, a difference of 0.030%), and New Zealander (82.6%, a difference of 0.040%).
| Demographics | Rating | Rank | In Labor Force | Age 45-54 |
| Immigrants | Switzerland | 39.4 /100 | #179 | Fair 82.7% |
| Hungarians | 38.0 /100 | #180 | Fair 82.7% |
| Israelis | 37.7 /100 | #181 | Fair 82.7% |
| Immigrants | Hungary | 37.1 /100 | #182 | Fair 82.7% |
| New Zealanders | 32.7 /100 | #183 | Fair 82.6% |
| Europeans | 32.6 /100 | #184 | Fair 82.6% |
| Immigrants | England | 32.2 /100 | #185 | Fair 82.6% |
| Irish | 29.2 /100 | #186 | Fair 82.6% |
| Immigrants | Costa Rica | 28.3 /100 | #187 | Fair 82.6% |
| South Africans | 28.0 /100 | #188 | Fair 82.6% |
| Syrians | 26.0 /100 | #189 | Fair 82.6% |
| British | 25.7 /100 | #190 | Fair 82.6% |
| Armenians | 23.2 /100 | #191 | Fair 82.5% |
| Immigrants | Iraq | 20.9 /100 | #192 | Fair 82.5% |
| Australians | 20.8 /100 | #193 | Fair 82.5% |
Demographics Similar to Immigrants from Ecuador by In Labor Force | Age 45-54
In terms of in labor force | age 45-54, the demographic groups most similar to Immigrants from Ecuador are Panamanian (82.2%, a difference of 0.0%), Bahamian (82.2%, a difference of 0.010%), Immigrants (82.1%, a difference of 0.020%), French (82.2%, a difference of 0.040%), and English (82.2%, a difference of 0.060%).
| Demographics | Rating | Rank | In Labor Force | Age 45-54 |
| Iraqis | 5.6 /100 | #215 | Tragic 82.2% |
| Scottish | 5.3 /100 | #216 | Tragic 82.2% |
| Portuguese | 4.7 /100 | #217 | Tragic 82.2% |
| English | 4.4 /100 | #218 | Tragic 82.2% |
| French | 4.1 /100 | #219 | Tragic 82.2% |
| Bahamians | 3.6 /100 | #220 | Tragic 82.2% |
| Panamanians | 3.5 /100 | #221 | Tragic 82.2% |
| Immigrants | Ecuador | 3.4 /100 | #222 | Tragic 82.2% |
| Immigrants | Immigrants | 3.1 /100 | #223 | Tragic 82.1% |
| Immigrants | Jamaica | 2.7 /100 | #224 | Tragic 82.1% |
| Immigrants | Oceania | 2.5 /100 | #225 | Tragic 82.1% |
| Immigrants | Caribbean | 2.5 /100 | #226 | Tragic 82.1% |
| Immigrants | Germany | 2.4 /100 | #227 | Tragic 82.1% |
| Cape Verdeans | 2.1 /100 | #228 | Tragic 82.1% |
| Immigrants | Burma/Myanmar | 1.9 /100 | #229 | Tragic 82.0% |