Irish vs Mongolian In Labor Force | Age 45-54
COMPARE
Irish
Mongolian
In Labor Force | Age 45-54
In Labor Force | Age 45-54 Comparison
Irish
Mongolians
82.6%
IN LABOR FORCE | AGE 45-54
29.2/ 100
METRIC RATING
186th/ 347
METRIC RANK
83.3%
IN LABOR FORCE | AGE 45-54
94.2/ 100
METRIC RATING
100th/ 347
METRIC RANK
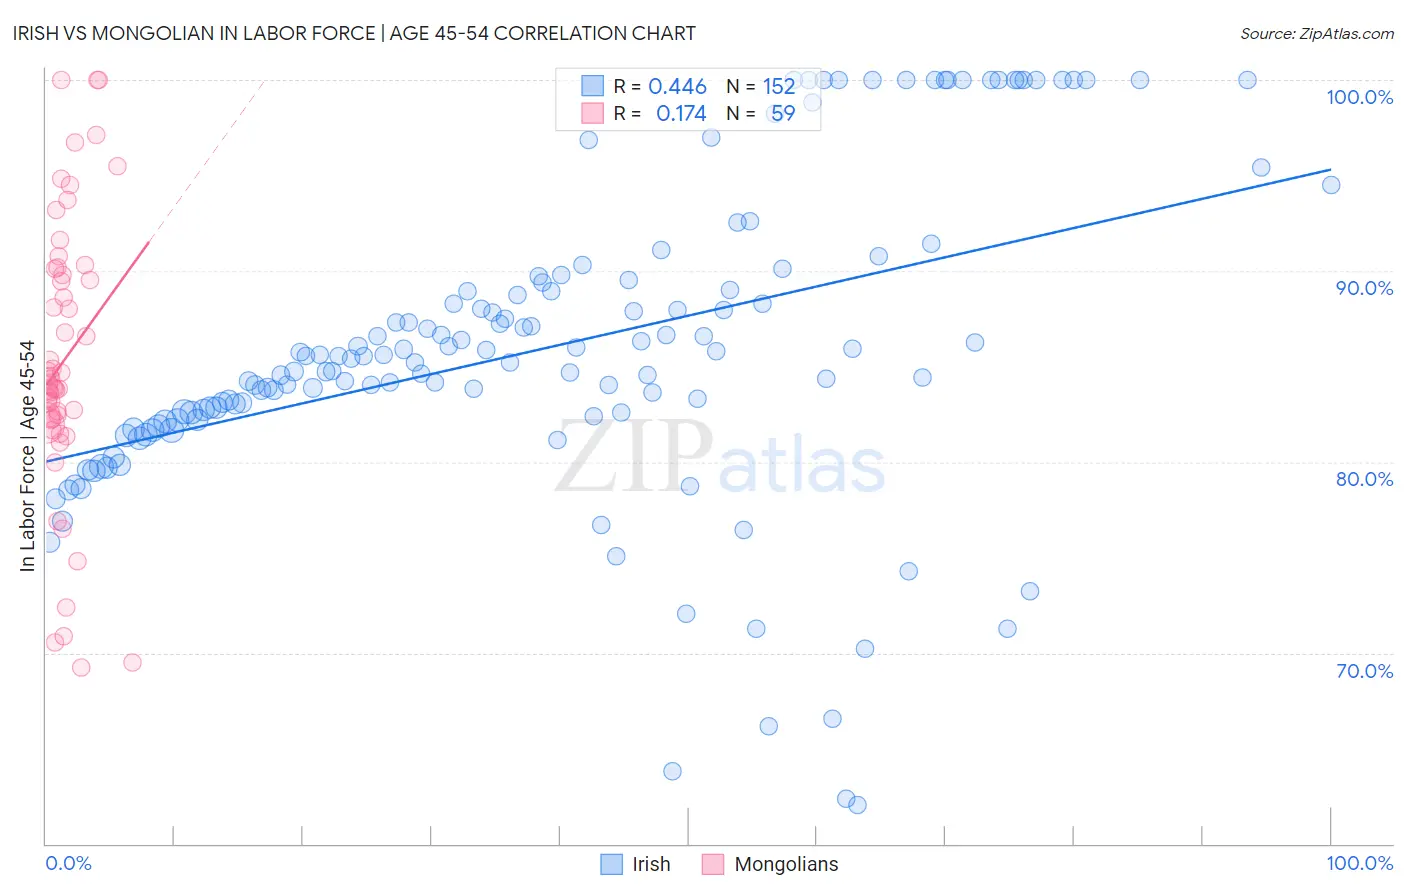
Irish vs Mongolian In Labor Force | Age 45-54 Correlation Chart
The statistical analysis conducted on geographies consisting of 579,633,404 people shows a moderate positive correlation between the proportion of Irish and labor force participation rate among population between the ages 45 and 54 in the United States with a correlation coefficient (R) of 0.446 and weighted average of 82.6%. Similarly, the statistical analysis conducted on geographies consisting of 140,286,535 people shows a poor positive correlation between the proportion of Mongolians and labor force participation rate among population between the ages 45 and 54 in the United States with a correlation coefficient (R) of 0.174 and weighted average of 83.3%, a difference of 0.81%.
In Labor Force | Age 45-54 Correlation Summary
| Measurement | Irish | Mongolian |
| Minimum | 62.0% | 69.2% |
| Maximum | 100.0% | 100.0% |
| Range | 38.0% | 30.8% |
| Mean | 86.0% | 85.3% |
| Median | 85.5% | 84.1% |
| Interquartile 25% (IQ1) | 82.3% | 82.2% |
| Interquartile 75% (IQ3) | 89.2% | 90.1% |
| Interquartile Range (IQR) | 6.9% | 7.9% |
| Standard Deviation (Sample) | 8.2% | 7.3% |
| Standard Deviation (Population) | 8.2% | 7.2% |
Similar Demographics by In Labor Force | Age 45-54
Demographics Similar to Irish by In Labor Force | Age 45-54
In terms of in labor force | age 45-54, the demographic groups most similar to Irish are Immigrants from Costa Rica (82.6%, a difference of 0.010%), South African (82.6%, a difference of 0.010%), Immigrants from England (82.6%, a difference of 0.030%), Syrian (82.6%, a difference of 0.030%), and New Zealander (82.6%, a difference of 0.040%).
| Demographics | Rating | Rank | In Labor Force | Age 45-54 |
| Immigrants | Switzerland | 39.4 /100 | #179 | Fair 82.7% |
| Hungarians | 38.0 /100 | #180 | Fair 82.7% |
| Israelis | 37.7 /100 | #181 | Fair 82.7% |
| Immigrants | Hungary | 37.1 /100 | #182 | Fair 82.7% |
| New Zealanders | 32.7 /100 | #183 | Fair 82.6% |
| Europeans | 32.6 /100 | #184 | Fair 82.6% |
| Immigrants | England | 32.2 /100 | #185 | Fair 82.6% |
| Irish | 29.2 /100 | #186 | Fair 82.6% |
| Immigrants | Costa Rica | 28.3 /100 | #187 | Fair 82.6% |
| South Africans | 28.0 /100 | #188 | Fair 82.6% |
| Syrians | 26.0 /100 | #189 | Fair 82.6% |
| British | 25.7 /100 | #190 | Fair 82.6% |
| Armenians | 23.2 /100 | #191 | Fair 82.5% |
| Immigrants | Iraq | 20.9 /100 | #192 | Fair 82.5% |
| Australians | 20.8 /100 | #193 | Fair 82.5% |
Demographics Similar to Mongolians by In Labor Force | Age 45-54
In terms of in labor force | age 45-54, the demographic groups most similar to Mongolians are Immigrants from Middle Africa (83.3%, a difference of 0.0%), Immigrants from Belarus (83.3%, a difference of 0.0%), Maltese (83.3%, a difference of 0.010%), Immigrants from Singapore (83.3%, a difference of 0.010%), and Albanian (83.3%, a difference of 0.010%).
| Demographics | Rating | Rank | In Labor Force | Age 45-54 |
| Italians | 95.1 /100 | #93 | Exceptional 83.3% |
| Argentineans | 94.9 /100 | #94 | Exceptional 83.3% |
| Immigrants | Argentina | 94.9 /100 | #95 | Exceptional 83.3% |
| Immigrants | Kuwait | 94.8 /100 | #96 | Exceptional 83.3% |
| Palestinians | 94.8 /100 | #97 | Exceptional 83.3% |
| Maltese | 94.4 /100 | #98 | Exceptional 83.3% |
| Immigrants | Middle Africa | 94.3 /100 | #99 | Exceptional 83.3% |
| Mongolians | 94.2 /100 | #100 | Exceptional 83.3% |
| Immigrants | Belarus | 94.1 /100 | #101 | Exceptional 83.3% |
| Immigrants | Singapore | 93.9 /100 | #102 | Exceptional 83.3% |
| Albanians | 93.9 /100 | #103 | Exceptional 83.3% |
| Immigrants | Romania | 93.8 /100 | #104 | Exceptional 83.3% |
| Immigrants | South America | 93.5 /100 | #105 | Exceptional 83.2% |
| Sri Lankans | 93.2 /100 | #106 | Exceptional 83.2% |
| Iranians | 92.9 /100 | #107 | Exceptional 83.2% |