Cuban vs Immigrants from Ecuador In Labor Force | Age 45-54
COMPARE
Cuban
Immigrants from Ecuador
In Labor Force | Age 45-54
In Labor Force | Age 45-54 Comparison
Cubans
Immigrants from Ecuador
83.4%
IN LABOR FORCE | AGE 45-54
96.7/ 100
METRIC RATING
77th/ 347
METRIC RANK
82.2%
IN LABOR FORCE | AGE 45-54
3.4/ 100
METRIC RATING
222nd/ 347
METRIC RANK
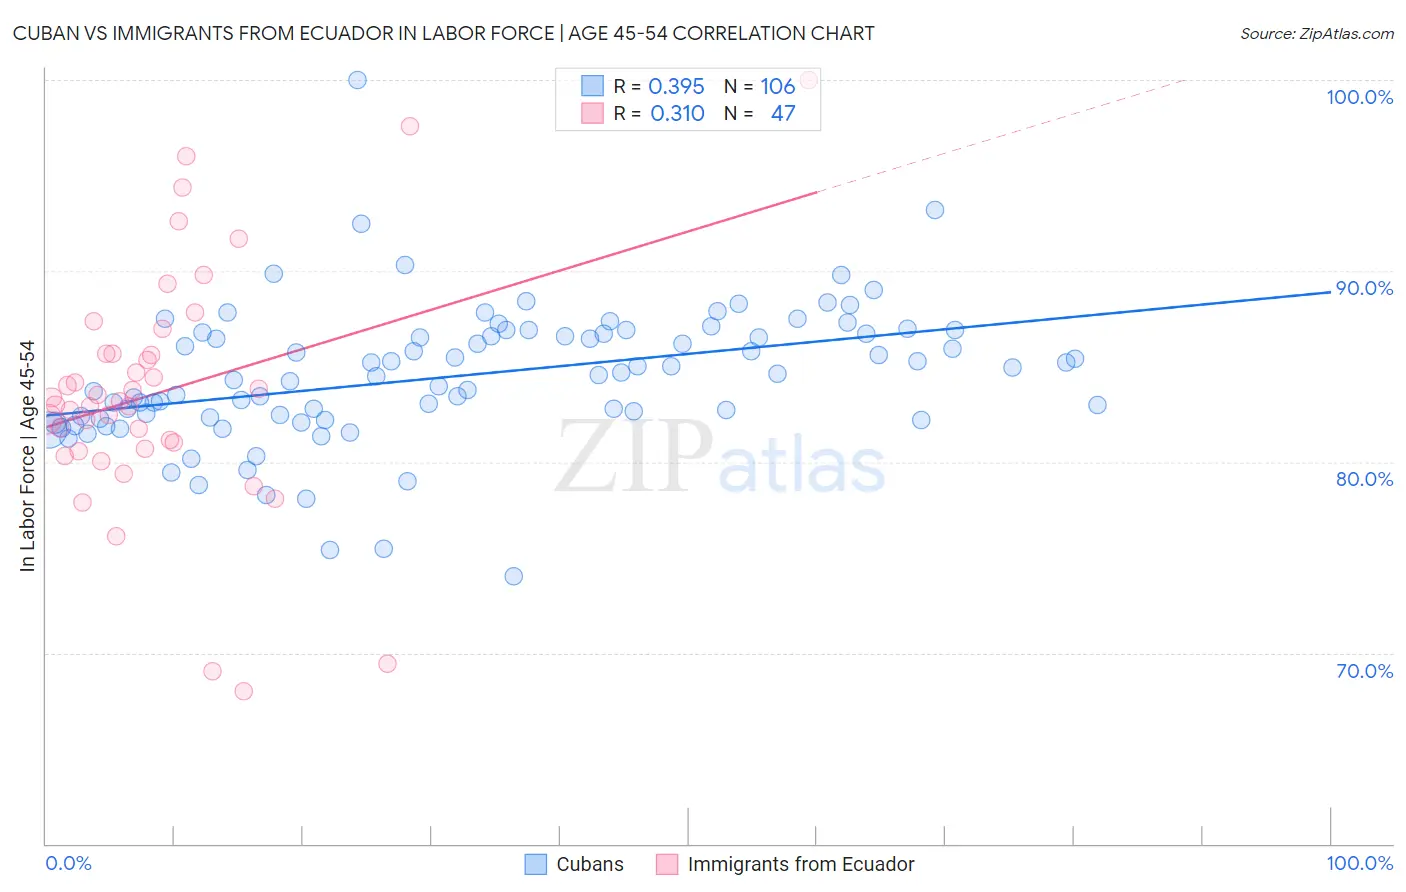
Cuban vs Immigrants from Ecuador In Labor Force | Age 45-54 Correlation Chart
The statistical analysis conducted on geographies consisting of 448,959,776 people shows a mild positive correlation between the proportion of Cubans and labor force participation rate among population between the ages 45 and 54 in the United States with a correlation coefficient (R) of 0.395 and weighted average of 83.4%. Similarly, the statistical analysis conducted on geographies consisting of 270,878,287 people shows a mild positive correlation between the proportion of Immigrants from Ecuador and labor force participation rate among population between the ages 45 and 54 in the United States with a correlation coefficient (R) of 0.310 and weighted average of 82.2%, a difference of 1.5%.
In Labor Force | Age 45-54 Correlation Summary
| Measurement | Cuban | Immigrants from Ecuador |
| Minimum | 74.0% | 68.0% |
| Maximum | 100.0% | 100.0% |
| Range | 26.0% | 32.0% |
| Mean | 84.5% | 83.7% |
| Median | 84.6% | 83.2% |
| Interquartile 25% (IQ1) | 82.3% | 80.7% |
| Interquartile 75% (IQ3) | 86.7% | 85.7% |
| Interquartile Range (IQR) | 4.4% | 5.0% |
| Standard Deviation (Sample) | 3.6% | 6.4% |
| Standard Deviation (Population) | 3.6% | 6.4% |
Similar Demographics by In Labor Force | Age 45-54
Demographics Similar to Cubans by In Labor Force | Age 45-54
In terms of in labor force | age 45-54, the demographic groups most similar to Cubans are Immigrants from Somalia (83.4%, a difference of 0.010%), Estonian (83.4%, a difference of 0.010%), Russian (83.4%, a difference of 0.010%), Immigrants from Egypt (83.4%, a difference of 0.010%), and Belgian (83.4%, a difference of 0.010%).
| Demographics | Rating | Rank | In Labor Force | Age 45-54 |
| Immigrants | Latvia | 97.4 /100 | #70 | Exceptional 83.4% |
| Colombians | 97.3 /100 | #71 | Exceptional 83.4% |
| Serbians | 97.2 /100 | #72 | Exceptional 83.4% |
| Immigrants | Czechoslovakia | 97.1 /100 | #73 | Exceptional 83.4% |
| Immigrants | Somalia | 96.9 /100 | #74 | Exceptional 83.4% |
| Estonians | 96.9 /100 | #75 | Exceptional 83.4% |
| Russians | 96.8 /100 | #76 | Exceptional 83.4% |
| Cubans | 96.7 /100 | #77 | Exceptional 83.4% |
| Immigrants | Egypt | 96.6 /100 | #78 | Exceptional 83.4% |
| Belgians | 96.5 /100 | #79 | Exceptional 83.4% |
| Immigrants | Croatia | 96.5 /100 | #80 | Exceptional 83.4% |
| Jordanians | 96.4 /100 | #81 | Exceptional 83.4% |
| Immigrants | Eastern Asia | 96.3 /100 | #82 | Exceptional 83.4% |
| Immigrants | Zimbabwe | 96.3 /100 | #83 | Exceptional 83.4% |
| Immigrants | Bosnia and Herzegovina | 96.0 /100 | #84 | Exceptional 83.3% |
Demographics Similar to Immigrants from Ecuador by In Labor Force | Age 45-54
In terms of in labor force | age 45-54, the demographic groups most similar to Immigrants from Ecuador are Panamanian (82.2%, a difference of 0.0%), Bahamian (82.2%, a difference of 0.010%), Immigrants (82.1%, a difference of 0.020%), French (82.2%, a difference of 0.040%), and English (82.2%, a difference of 0.060%).
| Demographics | Rating | Rank | In Labor Force | Age 45-54 |
| Iraqis | 5.6 /100 | #215 | Tragic 82.2% |
| Scottish | 5.3 /100 | #216 | Tragic 82.2% |
| Portuguese | 4.7 /100 | #217 | Tragic 82.2% |
| English | 4.4 /100 | #218 | Tragic 82.2% |
| French | 4.1 /100 | #219 | Tragic 82.2% |
| Bahamians | 3.6 /100 | #220 | Tragic 82.2% |
| Panamanians | 3.5 /100 | #221 | Tragic 82.2% |
| Immigrants | Ecuador | 3.4 /100 | #222 | Tragic 82.2% |
| Immigrants | Immigrants | 3.1 /100 | #223 | Tragic 82.1% |
| Immigrants | Jamaica | 2.7 /100 | #224 | Tragic 82.1% |
| Immigrants | Oceania | 2.5 /100 | #225 | Tragic 82.1% |
| Immigrants | Caribbean | 2.5 /100 | #226 | Tragic 82.1% |
| Immigrants | Germany | 2.4 /100 | #227 | Tragic 82.1% |
| Cape Verdeans | 2.1 /100 | #228 | Tragic 82.1% |
| Immigrants | Burma/Myanmar | 1.9 /100 | #229 | Tragic 82.0% |