Immigrants from Dominica vs Immigrants from Ecuador In Labor Force | Age 45-54
COMPARE
Immigrants from Dominica
Immigrants from Ecuador
In Labor Force | Age 45-54
In Labor Force | Age 45-54 Comparison
Immigrants from Dominica
Immigrants from Ecuador
80.8%
IN LABOR FORCE | AGE 45-54
0.0/ 100
METRIC RATING
286th/ 347
METRIC RANK
82.2%
IN LABOR FORCE | AGE 45-54
3.4/ 100
METRIC RATING
222nd/ 347
METRIC RANK
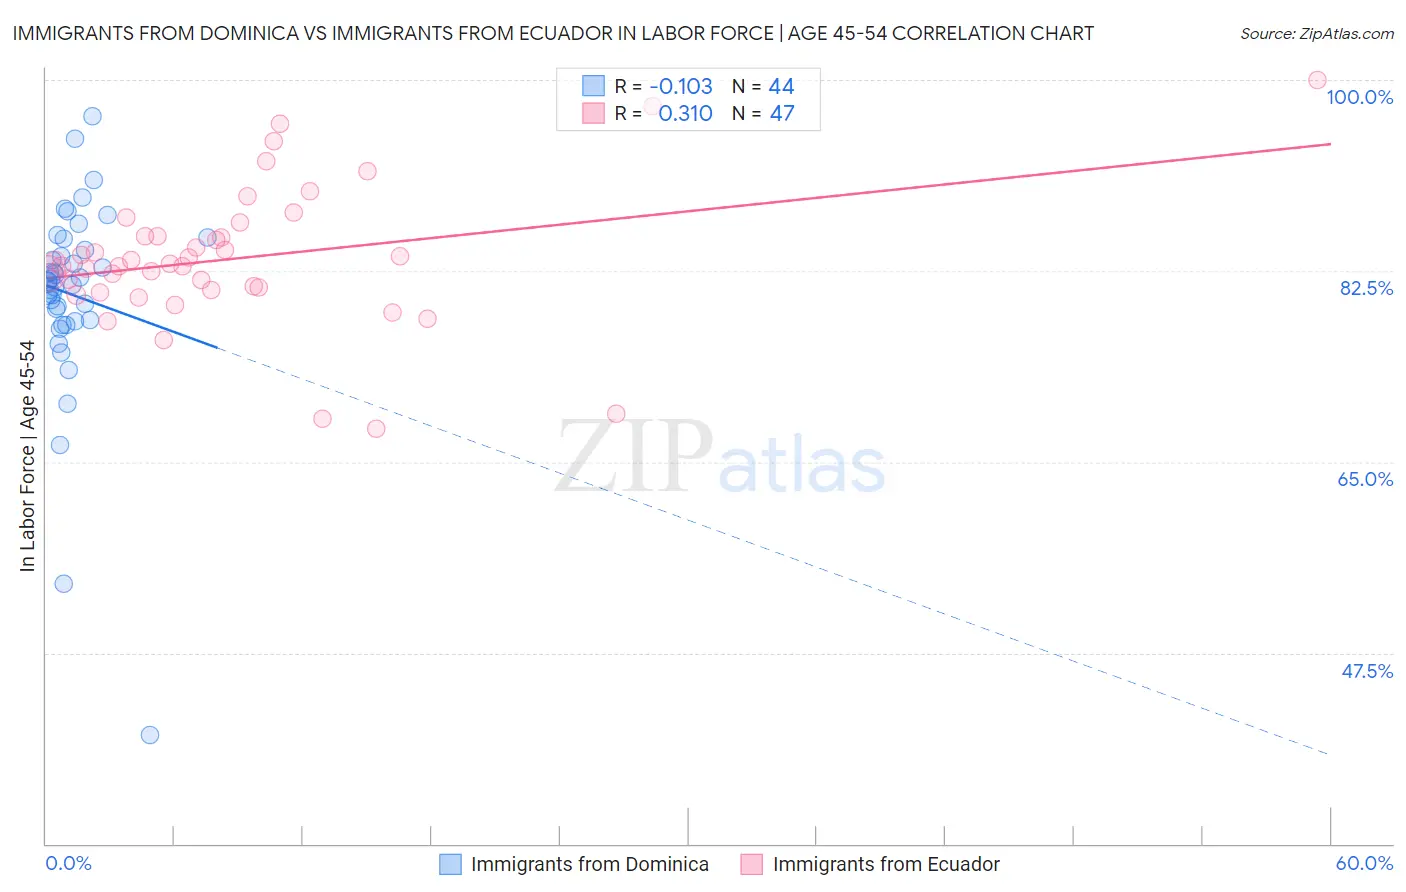
Immigrants from Dominica vs Immigrants from Ecuador In Labor Force | Age 45-54 Correlation Chart
The statistical analysis conducted on geographies consisting of 83,783,911 people shows a poor negative correlation between the proportion of Immigrants from Dominica and labor force participation rate among population between the ages 45 and 54 in the United States with a correlation coefficient (R) of -0.103 and weighted average of 80.8%. Similarly, the statistical analysis conducted on geographies consisting of 270,878,287 people shows a mild positive correlation between the proportion of Immigrants from Ecuador and labor force participation rate among population between the ages 45 and 54 in the United States with a correlation coefficient (R) of 0.310 and weighted average of 82.2%, a difference of 1.7%.
In Labor Force | Age 45-54 Correlation Summary
| Measurement | Immigrants from Dominica | Immigrants from Ecuador |
| Minimum | 40.0% | 68.0% |
| Maximum | 96.7% | 100.0% |
| Range | 56.7% | 32.0% |
| Mean | 80.3% | 83.7% |
| Median | 81.5% | 83.2% |
| Interquartile 25% (IQ1) | 78.0% | 80.7% |
| Interquartile 75% (IQ3) | 85.0% | 85.7% |
| Interquartile Range (IQR) | 7.0% | 5.0% |
| Standard Deviation (Sample) | 9.4% | 6.4% |
| Standard Deviation (Population) | 9.3% | 6.4% |
Similar Demographics by In Labor Force | Age 45-54
Demographics Similar to Immigrants from Dominica by In Labor Force | Age 45-54
In terms of in labor force | age 45-54, the demographic groups most similar to Immigrants from Dominica are Vietnamese (80.8%, a difference of 0.0%), Belizean (80.8%, a difference of 0.010%), Delaware (80.8%, a difference of 0.010%), Cree (80.8%, a difference of 0.010%), and Immigrants from Bangladesh (80.7%, a difference of 0.040%).
| Demographics | Rating | Rank | In Labor Force | Age 45-54 |
| Immigrants | Micronesia | 0.0 /100 | #279 | Tragic 81.1% |
| Immigrants | Latin America | 0.0 /100 | #280 | Tragic 81.0% |
| Immigrants | Grenada | 0.0 /100 | #281 | Tragic 81.0% |
| Aleuts | 0.0 /100 | #282 | Tragic 81.0% |
| French American Indians | 0.0 /100 | #283 | Tragic 80.8% |
| Belizeans | 0.0 /100 | #284 | Tragic 80.8% |
| Delaware | 0.0 /100 | #285 | Tragic 80.8% |
| Immigrants | Dominica | 0.0 /100 | #286 | Tragic 80.8% |
| Vietnamese | 0.0 /100 | #287 | Tragic 80.8% |
| Cree | 0.0 /100 | #288 | Tragic 80.8% |
| Immigrants | Bangladesh | 0.0 /100 | #289 | Tragic 80.7% |
| Mexican American Indians | 0.0 /100 | #290 | Tragic 80.7% |
| Immigrants | Belize | 0.0 /100 | #291 | Tragic 80.6% |
| Iroquois | 0.0 /100 | #292 | Tragic 80.6% |
| Osage | 0.0 /100 | #293 | Tragic 80.6% |
Demographics Similar to Immigrants from Ecuador by In Labor Force | Age 45-54
In terms of in labor force | age 45-54, the demographic groups most similar to Immigrants from Ecuador are Panamanian (82.2%, a difference of 0.0%), Bahamian (82.2%, a difference of 0.010%), Immigrants (82.1%, a difference of 0.020%), French (82.2%, a difference of 0.040%), and English (82.2%, a difference of 0.060%).
| Demographics | Rating | Rank | In Labor Force | Age 45-54 |
| Iraqis | 5.6 /100 | #215 | Tragic 82.2% |
| Scottish | 5.3 /100 | #216 | Tragic 82.2% |
| Portuguese | 4.7 /100 | #217 | Tragic 82.2% |
| English | 4.4 /100 | #218 | Tragic 82.2% |
| French | 4.1 /100 | #219 | Tragic 82.2% |
| Bahamians | 3.6 /100 | #220 | Tragic 82.2% |
| Panamanians | 3.5 /100 | #221 | Tragic 82.2% |
| Immigrants | Ecuador | 3.4 /100 | #222 | Tragic 82.2% |
| Immigrants | Immigrants | 3.1 /100 | #223 | Tragic 82.1% |
| Immigrants | Jamaica | 2.7 /100 | #224 | Tragic 82.1% |
| Immigrants | Oceania | 2.5 /100 | #225 | Tragic 82.1% |
| Immigrants | Caribbean | 2.5 /100 | #226 | Tragic 82.1% |
| Immigrants | Germany | 2.4 /100 | #227 | Tragic 82.1% |
| Cape Verdeans | 2.1 /100 | #228 | Tragic 82.1% |
| Immigrants | Burma/Myanmar | 1.9 /100 | #229 | Tragic 82.0% |