Irish vs Yaqui In Labor Force | Age 45-54
COMPARE
Irish
Yaqui
In Labor Force | Age 45-54
In Labor Force | Age 45-54 Comparison
Irish
Yaqui
82.6%
IN LABOR FORCE | AGE 45-54
29.2/ 100
METRIC RATING
186th/ 347
METRIC RANK
78.9%
IN LABOR FORCE | AGE 45-54
0.0/ 100
METRIC RATING
320th/ 347
METRIC RANK
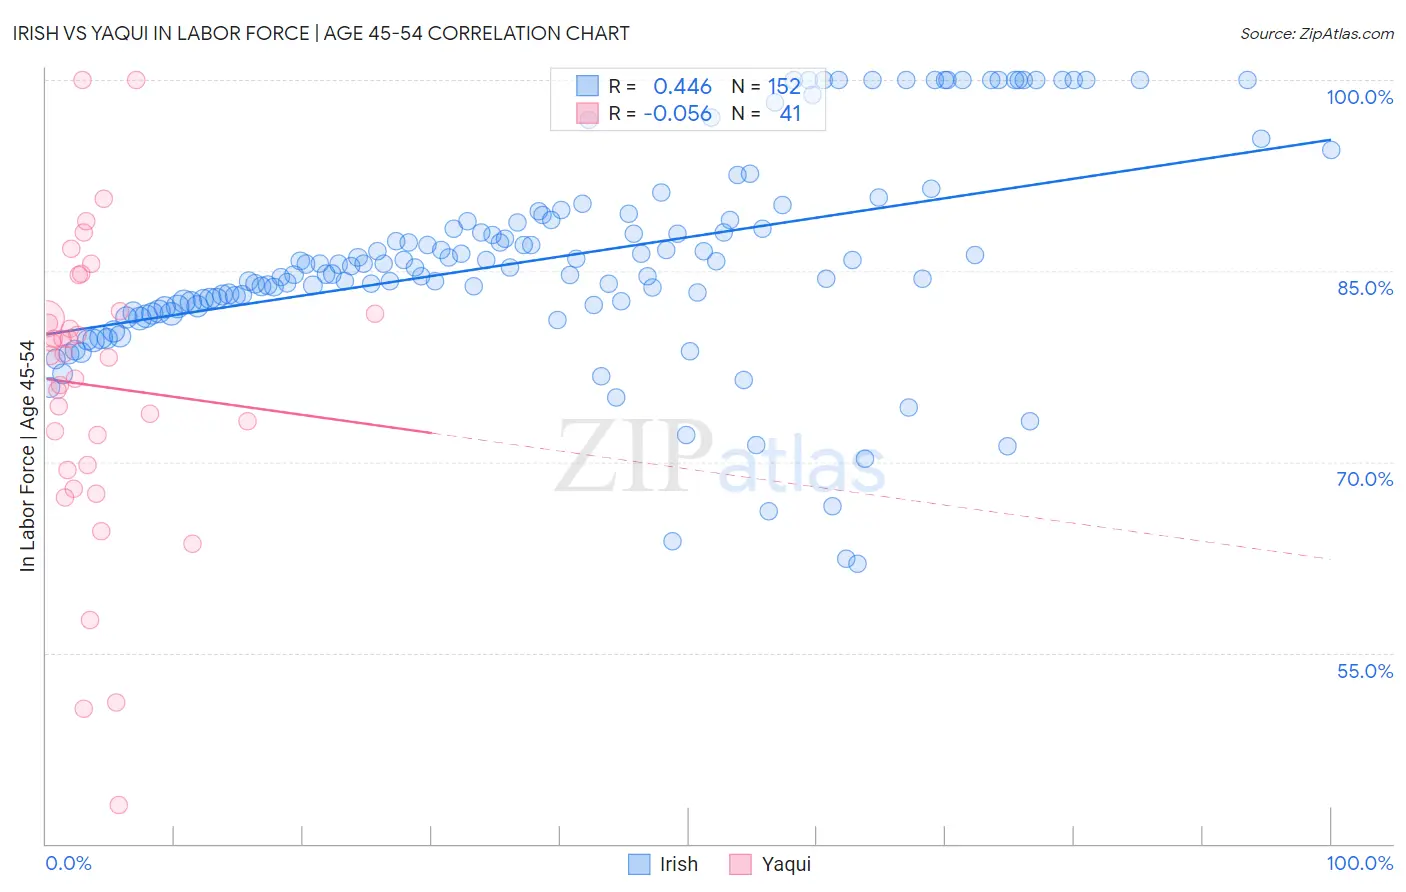
Irish vs Yaqui In Labor Force | Age 45-54 Correlation Chart
The statistical analysis conducted on geographies consisting of 579,633,404 people shows a moderate positive correlation between the proportion of Irish and labor force participation rate among population between the ages 45 and 54 in the United States with a correlation coefficient (R) of 0.446 and weighted average of 82.6%. Similarly, the statistical analysis conducted on geographies consisting of 107,713,051 people shows a slight negative correlation between the proportion of Yaqui and labor force participation rate among population between the ages 45 and 54 in the United States with a correlation coefficient (R) of -0.056 and weighted average of 78.9%, a difference of 4.7%.
In Labor Force | Age 45-54 Correlation Summary
| Measurement | Irish | Yaqui |
| Minimum | 62.0% | 43.0% |
| Maximum | 100.0% | 100.0% |
| Range | 38.0% | 57.0% |
| Mean | 86.0% | 76.0% |
| Median | 85.5% | 78.4% |
| Interquartile 25% (IQ1) | 82.3% | 69.6% |
| Interquartile 75% (IQ3) | 89.2% | 81.7% |
| Interquartile Range (IQR) | 6.9% | 12.1% |
| Standard Deviation (Sample) | 8.2% | 11.8% |
| Standard Deviation (Population) | 8.2% | 11.7% |
Similar Demographics by In Labor Force | Age 45-54
Demographics Similar to Irish by In Labor Force | Age 45-54
In terms of in labor force | age 45-54, the demographic groups most similar to Irish are Immigrants from Costa Rica (82.6%, a difference of 0.010%), South African (82.6%, a difference of 0.010%), Immigrants from England (82.6%, a difference of 0.030%), Syrian (82.6%, a difference of 0.030%), and New Zealander (82.6%, a difference of 0.040%).
| Demographics | Rating | Rank | In Labor Force | Age 45-54 |
| Immigrants | Switzerland | 39.4 /100 | #179 | Fair 82.7% |
| Hungarians | 38.0 /100 | #180 | Fair 82.7% |
| Israelis | 37.7 /100 | #181 | Fair 82.7% |
| Immigrants | Hungary | 37.1 /100 | #182 | Fair 82.7% |
| New Zealanders | 32.7 /100 | #183 | Fair 82.6% |
| Europeans | 32.6 /100 | #184 | Fair 82.6% |
| Immigrants | England | 32.2 /100 | #185 | Fair 82.6% |
| Irish | 29.2 /100 | #186 | Fair 82.6% |
| Immigrants | Costa Rica | 28.3 /100 | #187 | Fair 82.6% |
| South Africans | 28.0 /100 | #188 | Fair 82.6% |
| Syrians | 26.0 /100 | #189 | Fair 82.6% |
| British | 25.7 /100 | #190 | Fair 82.6% |
| Armenians | 23.2 /100 | #191 | Fair 82.5% |
| Immigrants | Iraq | 20.9 /100 | #192 | Fair 82.5% |
| Australians | 20.8 /100 | #193 | Fair 82.5% |
Demographics Similar to Yaqui by In Labor Force | Age 45-54
In terms of in labor force | age 45-54, the demographic groups most similar to Yaqui are Cherokee (79.0%, a difference of 0.10%), Chickasaw (79.0%, a difference of 0.21%), Yup'ik (78.6%, a difference of 0.30%), Comanche (79.2%, a difference of 0.38%), and Shoshone (79.3%, a difference of 0.52%).
| Demographics | Rating | Rank | In Labor Force | Age 45-54 |
| Colville | 0.0 /100 | #313 | Tragic 79.5% |
| Ottawa | 0.0 /100 | #314 | Tragic 79.5% |
| Blacks/African Americans | 0.0 /100 | #315 | Tragic 79.3% |
| Shoshone | 0.0 /100 | #316 | Tragic 79.3% |
| Comanche | 0.0 /100 | #317 | Tragic 79.2% |
| Chickasaw | 0.0 /100 | #318 | Tragic 79.0% |
| Cherokee | 0.0 /100 | #319 | Tragic 79.0% |
| Yaqui | 0.0 /100 | #320 | Tragic 78.9% |
| Yup'ik | 0.0 /100 | #321 | Tragic 78.6% |
| Crow | 0.0 /100 | #322 | Tragic 78.3% |
| Kiowa | 0.0 /100 | #323 | Tragic 78.3% |
| Dutch West Indians | 0.0 /100 | #324 | Tragic 78.2% |
| Choctaw | 0.0 /100 | #325 | Tragic 78.2% |
| Seminole | 0.0 /100 | #326 | Tragic 78.1% |
| Cajuns | 0.0 /100 | #327 | Tragic 78.1% |