Irish vs Immigrants from Ecuador Unemployment Among Seniors over 75 years
COMPARE
Irish
Immigrants from Ecuador
Unemployment Among Seniors over 75 years
Unemployment Among Seniors over 75 years Comparison
Irish
Immigrants from Ecuador
10.2%
UNEMPLOYMENT AMONG SENIORS OVER 75 YEARS
0.0/ 100
METRIC RATING
317th/ 347
METRIC RANK
8.5%
UNEMPLOYMENT AMONG SENIORS OVER 75 YEARS
84.6/ 100
METRIC RATING
149th/ 347
METRIC RANK
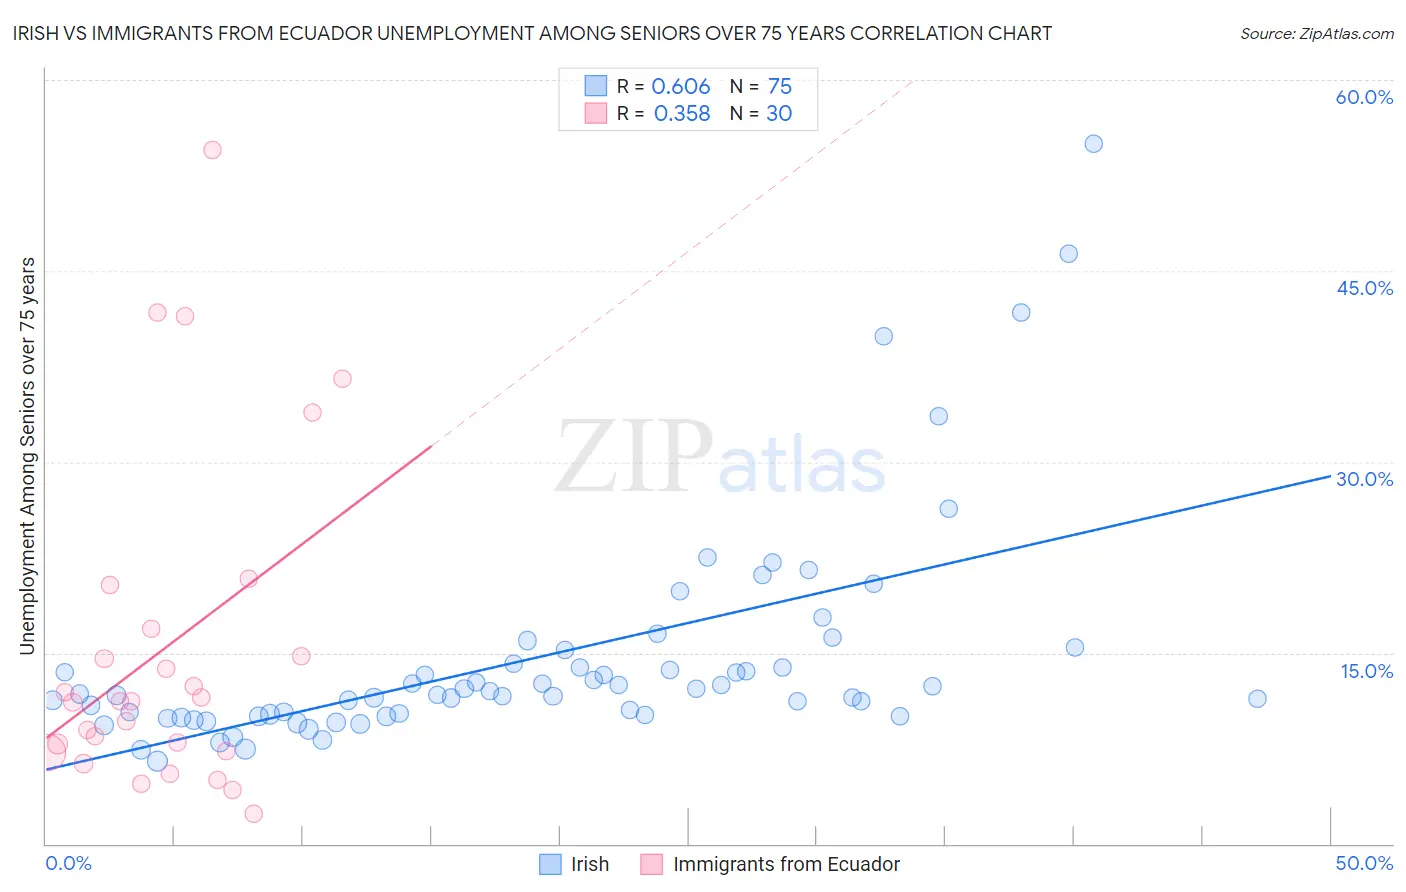
Irish vs Immigrants from Ecuador Unemployment Among Seniors over 75 years Correlation Chart
The statistical analysis conducted on geographies consisting of 235,224,616 people shows a significant positive correlation between the proportion of Irish and unemployment rate among seniors over the age of 75 in the United States with a correlation coefficient (R) of 0.606 and weighted average of 10.2%. Similarly, the statistical analysis conducted on geographies consisting of 159,053,879 people shows a mild positive correlation between the proportion of Immigrants from Ecuador and unemployment rate among seniors over the age of 75 in the United States with a correlation coefficient (R) of 0.358 and weighted average of 8.5%, a difference of 19.7%.
Unemployment Among Seniors over 75 years Correlation Summary
| Measurement | Irish | Immigrants from Ecuador |
| Minimum | 6.5% | 2.4% |
| Maximum | 55.0% | 54.5% |
| Range | 48.5% | 52.1% |
| Mean | 14.6% | 15.5% |
| Median | 11.8% | 11.2% |
| Interquartile 25% (IQ1) | 10.1% | 7.3% |
| Interquartile 75% (IQ3) | 14.1% | 16.9% |
| Interquartile Range (IQR) | 4.0% | 9.6% |
| Standard Deviation (Sample) | 8.8% | 13.0% |
| Standard Deviation (Population) | 8.7% | 12.8% |
Similar Demographics by Unemployment Among Seniors over 75 years
Demographics Similar to Irish by Unemployment Among Seniors over 75 years
In terms of unemployment among seniors over 75 years, the demographic groups most similar to Irish are Liberian (10.2%, a difference of 0.12%), German (10.3%, a difference of 0.20%), Native/Alaskan (10.2%, a difference of 0.37%), French (10.3%, a difference of 0.42%), and Aleut (10.3%, a difference of 0.43%).
| Demographics | Rating | Rank | Unemployment Among Seniors over 75 years |
| Hungarians | 0.0 /100 | #310 | Tragic 10.1% |
| Scottish | 0.0 /100 | #311 | Tragic 10.1% |
| Chippewa | 0.0 /100 | #312 | Tragic 10.1% |
| Nepalese | 0.0 /100 | #313 | Tragic 10.1% |
| Dutch West Indians | 0.0 /100 | #314 | Tragic 10.2% |
| Pennsylvania Germans | 0.0 /100 | #315 | Tragic 10.2% |
| Natives/Alaskans | 0.0 /100 | #316 | Tragic 10.2% |
| Irish | 0.0 /100 | #317 | Tragic 10.2% |
| Liberians | 0.0 /100 | #318 | Tragic 10.2% |
| Germans | 0.0 /100 | #319 | Tragic 10.3% |
| French | 0.0 /100 | #320 | Tragic 10.3% |
| Aleuts | 0.0 /100 | #321 | Tragic 10.3% |
| Poles | 0.0 /100 | #322 | Tragic 10.3% |
| Tongans | 0.0 /100 | #323 | Tragic 10.4% |
| Americans | 0.0 /100 | #324 | Tragic 10.4% |
Demographics Similar to Immigrants from Ecuador by Unemployment Among Seniors over 75 years
In terms of unemployment among seniors over 75 years, the demographic groups most similar to Immigrants from Ecuador are Immigrants from Sierra Leone (8.5%, a difference of 0.11%), Immigrants from Colombia (8.5%, a difference of 0.11%), Immigrants from South Eastern Asia (8.5%, a difference of 0.13%), Immigrants from Romania (8.5%, a difference of 0.18%), and Paiute (8.6%, a difference of 0.21%).
| Demographics | Rating | Rank | Unemployment Among Seniors over 75 years |
| Immigrants | Ukraine | 87.0 /100 | #142 | Excellent 8.5% |
| Immigrants | Costa Rica | 86.8 /100 | #143 | Excellent 8.5% |
| Colombians | 86.7 /100 | #144 | Excellent 8.5% |
| Immigrants | Romania | 86.2 /100 | #145 | Excellent 8.5% |
| Immigrants | South Eastern Asia | 85.8 /100 | #146 | Excellent 8.5% |
| Immigrants | Sierra Leone | 85.6 /100 | #147 | Excellent 8.5% |
| Immigrants | Colombia | 85.6 /100 | #148 | Excellent 8.5% |
| Immigrants | Ecuador | 84.6 /100 | #149 | Excellent 8.5% |
| Paiute | 82.5 /100 | #150 | Excellent 8.6% |
| Immigrants | Bosnia and Herzegovina | 80.6 /100 | #151 | Excellent 8.6% |
| Latvians | 80.5 /100 | #152 | Excellent 8.6% |
| Mongolians | 80.1 /100 | #153 | Excellent 8.6% |
| Immigrants | Pakistan | 79.7 /100 | #154 | Good 8.6% |
| Ecuadorians | 78.5 /100 | #155 | Good 8.6% |
| Immigrants | Bahamas | 76.5 /100 | #156 | Good 8.6% |