Slovak vs Immigrants from Ecuador In Labor Force | Age 45-54
COMPARE
Slovak
Immigrants from Ecuador
In Labor Force | Age 45-54
In Labor Force | Age 45-54 Comparison
Slovaks
Immigrants from Ecuador
83.2%
IN LABOR FORCE | AGE 45-54
92.8/ 100
METRIC RATING
108th/ 347
METRIC RANK
82.2%
IN LABOR FORCE | AGE 45-54
3.4/ 100
METRIC RATING
222nd/ 347
METRIC RANK
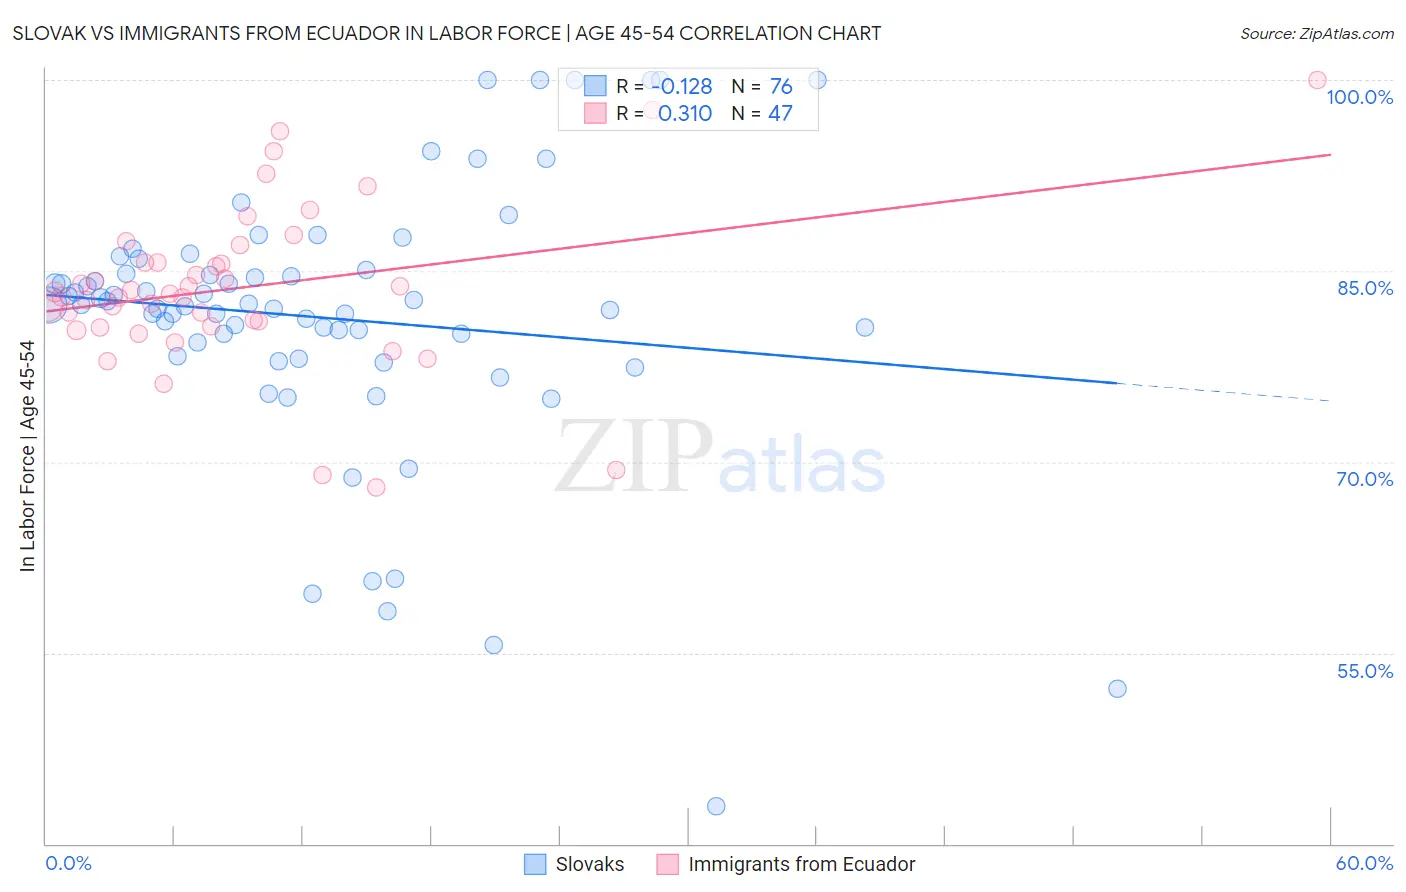
Slovak vs Immigrants from Ecuador In Labor Force | Age 45-54 Correlation Chart
The statistical analysis conducted on geographies consisting of 397,668,603 people shows a poor negative correlation between the proportion of Slovaks and labor force participation rate among population between the ages 45 and 54 in the United States with a correlation coefficient (R) of -0.128 and weighted average of 83.2%. Similarly, the statistical analysis conducted on geographies consisting of 270,878,287 people shows a mild positive correlation between the proportion of Immigrants from Ecuador and labor force participation rate among population between the ages 45 and 54 in the United States with a correlation coefficient (R) of 0.310 and weighted average of 82.2%, a difference of 1.3%.
In Labor Force | Age 45-54 Correlation Summary
| Measurement | Slovak | Immigrants from Ecuador |
| Minimum | 42.9% | 68.0% |
| Maximum | 100.0% | 100.0% |
| Range | 57.1% | 32.0% |
| Mean | 81.3% | 83.7% |
| Median | 82.4% | 83.2% |
| Interquartile 25% (IQ1) | 78.8% | 80.7% |
| Interquartile 75% (IQ3) | 84.9% | 85.7% |
| Interquartile Range (IQR) | 6.1% | 5.0% |
| Standard Deviation (Sample) | 10.6% | 6.4% |
| Standard Deviation (Population) | 10.5% | 6.4% |
Similar Demographics by In Labor Force | Age 45-54
Demographics Similar to Slovaks by In Labor Force | Age 45-54
In terms of in labor force | age 45-54, the demographic groups most similar to Slovaks are Iranian (83.2%, a difference of 0.0%), Ukrainian (83.2%, a difference of 0.0%), Immigrants from Africa (83.2%, a difference of 0.0%), Sri Lankan (83.2%, a difference of 0.010%), and Immigrants from Italy (83.2%, a difference of 0.010%).
| Demographics | Rating | Rank | In Labor Force | Age 45-54 |
| Immigrants | Belarus | 94.1 /100 | #101 | Exceptional 83.3% |
| Immigrants | Singapore | 93.9 /100 | #102 | Exceptional 83.3% |
| Albanians | 93.9 /100 | #103 | Exceptional 83.3% |
| Immigrants | Romania | 93.8 /100 | #104 | Exceptional 83.3% |
| Immigrants | South America | 93.5 /100 | #105 | Exceptional 83.2% |
| Sri Lankans | 93.2 /100 | #106 | Exceptional 83.2% |
| Iranians | 92.9 /100 | #107 | Exceptional 83.2% |
| Slovaks | 92.8 /100 | #108 | Exceptional 83.2% |
| Ukrainians | 92.7 /100 | #109 | Exceptional 83.2% |
| Immigrants | Africa | 92.6 /100 | #110 | Exceptional 83.2% |
| Immigrants | Italy | 92.5 /100 | #111 | Exceptional 83.2% |
| Immigrants | Afghanistan | 92.4 /100 | #112 | Exceptional 83.2% |
| Immigrants | Albania | 91.8 /100 | #113 | Exceptional 83.2% |
| Assyrians/Chaldeans/Syriacs | 91.7 /100 | #114 | Exceptional 83.2% |
| Immigrants | Chile | 91.6 /100 | #115 | Exceptional 83.2% |
Demographics Similar to Immigrants from Ecuador by In Labor Force | Age 45-54
In terms of in labor force | age 45-54, the demographic groups most similar to Immigrants from Ecuador are Panamanian (82.2%, a difference of 0.0%), Bahamian (82.2%, a difference of 0.010%), Immigrants (82.1%, a difference of 0.020%), French (82.2%, a difference of 0.040%), and English (82.2%, a difference of 0.060%).
| Demographics | Rating | Rank | In Labor Force | Age 45-54 |
| Iraqis | 5.6 /100 | #215 | Tragic 82.2% |
| Scottish | 5.3 /100 | #216 | Tragic 82.2% |
| Portuguese | 4.7 /100 | #217 | Tragic 82.2% |
| English | 4.4 /100 | #218 | Tragic 82.2% |
| French | 4.1 /100 | #219 | Tragic 82.2% |
| Bahamians | 3.6 /100 | #220 | Tragic 82.2% |
| Panamanians | 3.5 /100 | #221 | Tragic 82.2% |
| Immigrants | Ecuador | 3.4 /100 | #222 | Tragic 82.2% |
| Immigrants | Immigrants | 3.1 /100 | #223 | Tragic 82.1% |
| Immigrants | Jamaica | 2.7 /100 | #224 | Tragic 82.1% |
| Immigrants | Oceania | 2.5 /100 | #225 | Tragic 82.1% |
| Immigrants | Caribbean | 2.5 /100 | #226 | Tragic 82.1% |
| Immigrants | Germany | 2.4 /100 | #227 | Tragic 82.1% |
| Cape Verdeans | 2.1 /100 | #228 | Tragic 82.1% |
| Immigrants | Burma/Myanmar | 1.9 /100 | #229 | Tragic 82.0% |