Irish vs Immigrants from Guatemala In Labor Force | Age 45-54
COMPARE
Irish
Immigrants from Guatemala
In Labor Force | Age 45-54
In Labor Force | Age 45-54 Comparison
Irish
Immigrants from Guatemala
82.6%
IN LABOR FORCE | AGE 45-54
29.2/ 100
METRIC RATING
186th/ 347
METRIC RANK
81.1%
IN LABOR FORCE | AGE 45-54
0.0/ 100
METRIC RATING
278th/ 347
METRIC RANK
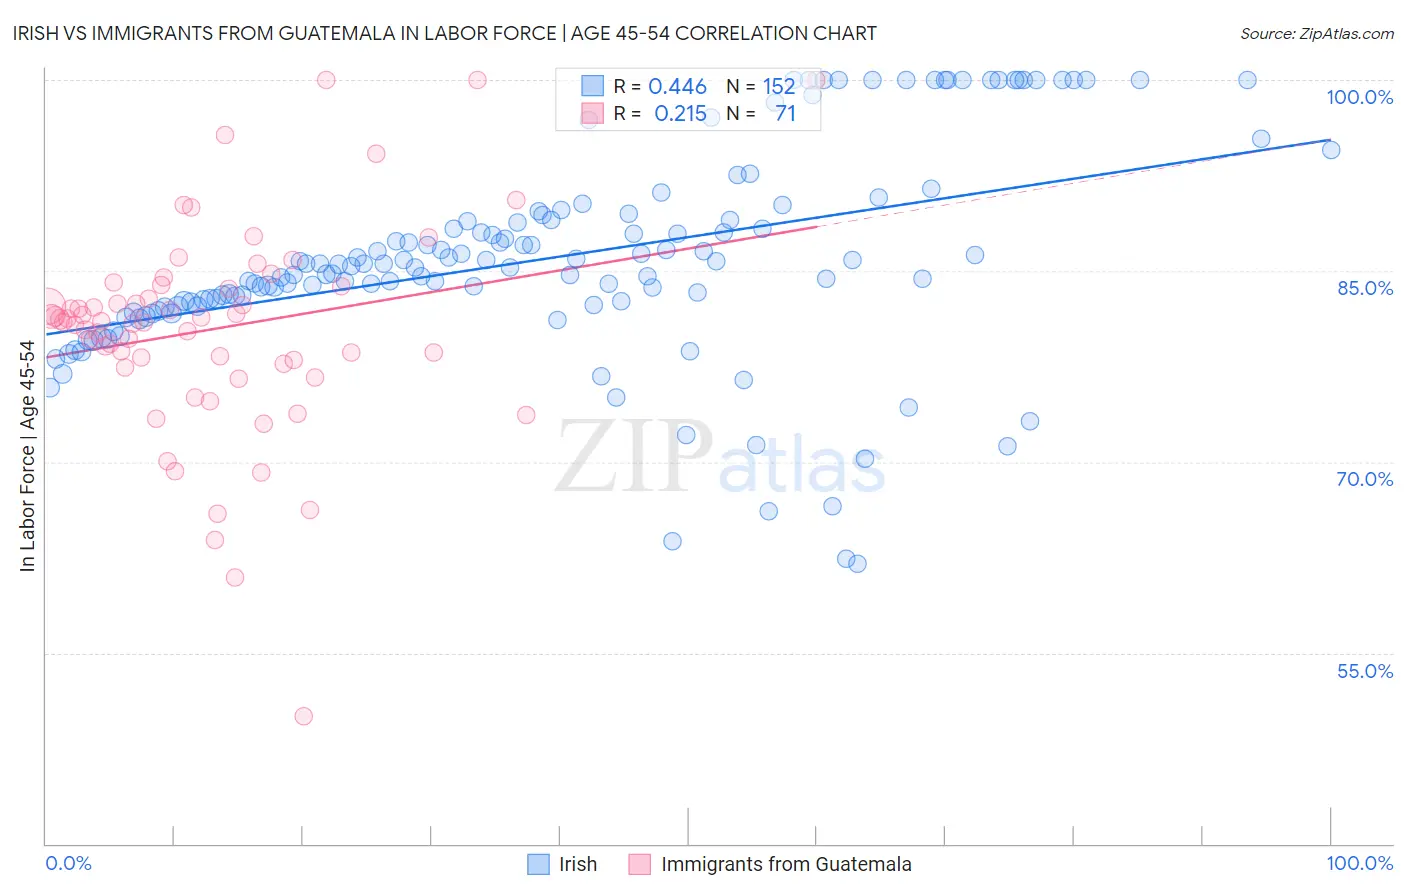
Irish vs Immigrants from Guatemala In Labor Force | Age 45-54 Correlation Chart
The statistical analysis conducted on geographies consisting of 579,633,404 people shows a moderate positive correlation between the proportion of Irish and labor force participation rate among population between the ages 45 and 54 in the United States with a correlation coefficient (R) of 0.446 and weighted average of 82.6%. Similarly, the statistical analysis conducted on geographies consisting of 377,151,916 people shows a weak positive correlation between the proportion of Immigrants from Guatemala and labor force participation rate among population between the ages 45 and 54 in the United States with a correlation coefficient (R) of 0.215 and weighted average of 81.1%, a difference of 1.8%.
In Labor Force | Age 45-54 Correlation Summary
| Measurement | Irish | Immigrants from Guatemala |
| Minimum | 62.0% | 50.0% |
| Maximum | 100.0% | 100.0% |
| Range | 38.0% | 50.0% |
| Mean | 86.0% | 80.4% |
| Median | 85.5% | 81.1% |
| Interquartile 25% (IQ1) | 82.3% | 77.7% |
| Interquartile 75% (IQ3) | 89.2% | 83.8% |
| Interquartile Range (IQR) | 6.9% | 6.1% |
| Standard Deviation (Sample) | 8.2% | 8.3% |
| Standard Deviation (Population) | 8.2% | 8.3% |
Similar Demographics by In Labor Force | Age 45-54
Demographics Similar to Irish by In Labor Force | Age 45-54
In terms of in labor force | age 45-54, the demographic groups most similar to Irish are Immigrants from Costa Rica (82.6%, a difference of 0.010%), South African (82.6%, a difference of 0.010%), Immigrants from England (82.6%, a difference of 0.030%), Syrian (82.6%, a difference of 0.030%), and New Zealander (82.6%, a difference of 0.040%).
| Demographics | Rating | Rank | In Labor Force | Age 45-54 |
| Immigrants | Switzerland | 39.4 /100 | #179 | Fair 82.7% |
| Hungarians | 38.0 /100 | #180 | Fair 82.7% |
| Israelis | 37.7 /100 | #181 | Fair 82.7% |
| Immigrants | Hungary | 37.1 /100 | #182 | Fair 82.7% |
| New Zealanders | 32.7 /100 | #183 | Fair 82.6% |
| Europeans | 32.6 /100 | #184 | Fair 82.6% |
| Immigrants | England | 32.2 /100 | #185 | Fair 82.6% |
| Irish | 29.2 /100 | #186 | Fair 82.6% |
| Immigrants | Costa Rica | 28.3 /100 | #187 | Fair 82.6% |
| South Africans | 28.0 /100 | #188 | Fair 82.6% |
| Syrians | 26.0 /100 | #189 | Fair 82.6% |
| British | 25.7 /100 | #190 | Fair 82.6% |
| Armenians | 23.2 /100 | #191 | Fair 82.5% |
| Immigrants | Iraq | 20.9 /100 | #192 | Fair 82.5% |
| Australians | 20.8 /100 | #193 | Fair 82.5% |
Demographics Similar to Immigrants from Guatemala by In Labor Force | Age 45-54
In terms of in labor force | age 45-54, the demographic groups most similar to Immigrants from Guatemala are Immigrants from Micronesia (81.1%, a difference of 0.010%), Guatemalan (81.2%, a difference of 0.080%), U.S. Virgin Islander (81.2%, a difference of 0.10%), Immigrants from Latin America (81.0%, a difference of 0.11%), and Immigrants from Grenada (81.0%, a difference of 0.12%).
| Demographics | Rating | Rank | In Labor Force | Age 45-54 |
| Immigrants | Barbados | 0.0 /100 | #271 | Tragic 81.3% |
| Spanish | 0.0 /100 | #272 | Tragic 81.3% |
| Chippewa | 0.0 /100 | #273 | Tragic 81.3% |
| British West Indians | 0.0 /100 | #274 | Tragic 81.2% |
| Immigrants | Nonimmigrants | 0.0 /100 | #275 | Tragic 81.2% |
| U.S. Virgin Islanders | 0.0 /100 | #276 | Tragic 81.2% |
| Guatemalans | 0.0 /100 | #277 | Tragic 81.2% |
| Immigrants | Guatemala | 0.0 /100 | #278 | Tragic 81.1% |
| Immigrants | Micronesia | 0.0 /100 | #279 | Tragic 81.1% |
| Immigrants | Latin America | 0.0 /100 | #280 | Tragic 81.0% |
| Immigrants | Grenada | 0.0 /100 | #281 | Tragic 81.0% |
| Aleuts | 0.0 /100 | #282 | Tragic 81.0% |
| French American Indians | 0.0 /100 | #283 | Tragic 80.8% |
| Belizeans | 0.0 /100 | #284 | Tragic 80.8% |
| Delaware | 0.0 /100 | #285 | Tragic 80.8% |