Iranian vs Immigrants from Europe In Labor Force | Age > 16
COMPARE
Iranian
Immigrants from Europe
In Labor Force | Age > 16
In Labor Force | Age > 16 Comparison
Iranians
Immigrants from Europe
66.0%
IN LABOR FORCE | AGE > 16
99.2/ 100
METRIC RATING
91st/ 347
METRIC RANK
65.0%
IN LABOR FORCE | AGE > 16
33.6/ 100
METRIC RATING
193rd/ 347
METRIC RANK
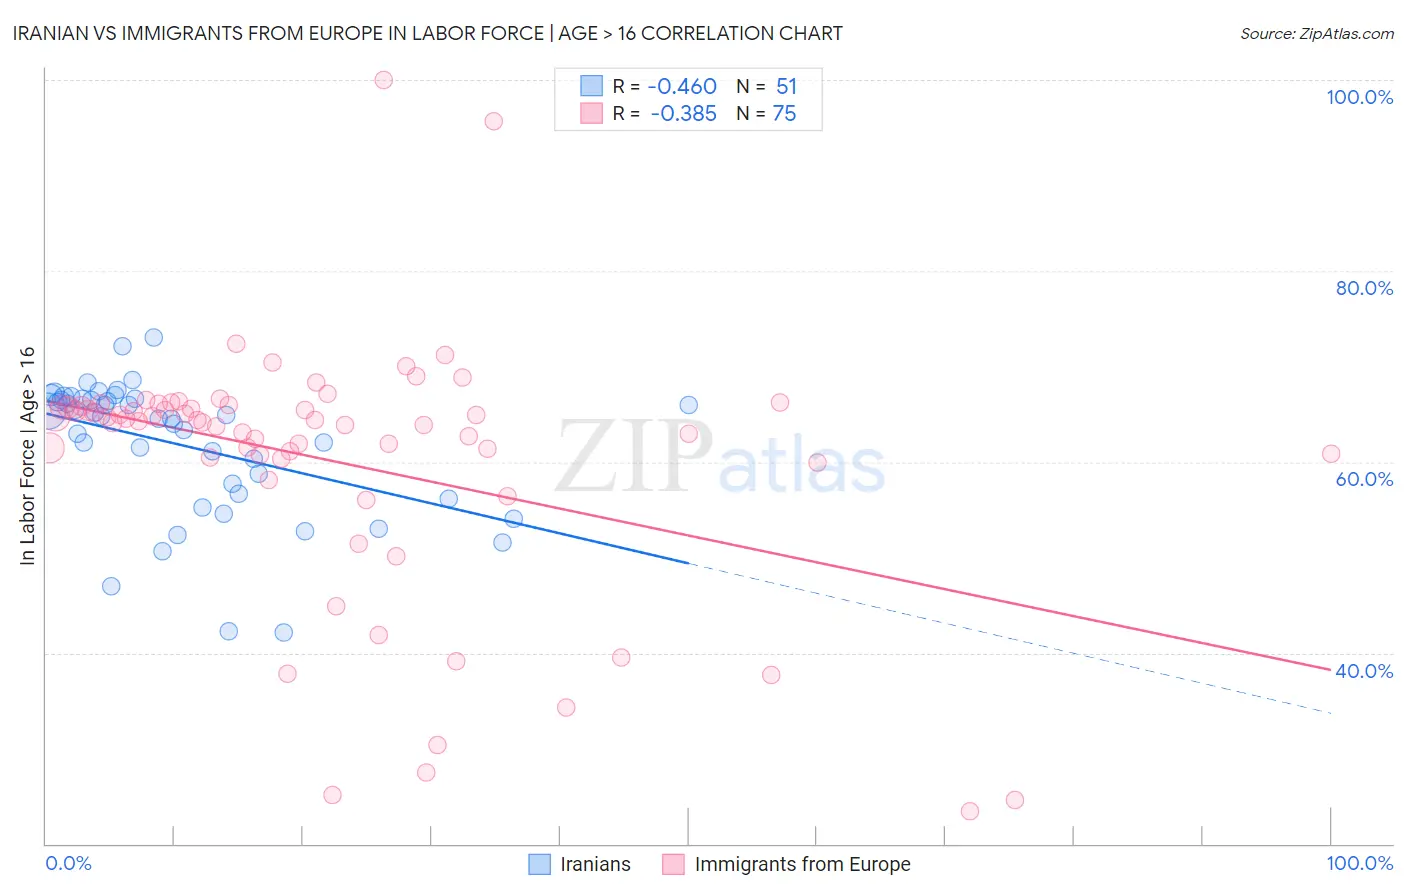
Iranian vs Immigrants from Europe In Labor Force | Age > 16 Correlation Chart
The statistical analysis conducted on geographies consisting of 316,907,854 people shows a moderate negative correlation between the proportion of Iranians and labor force participation rate among population ages 16 and over in the United States with a correlation coefficient (R) of -0.460 and weighted average of 66.0%. Similarly, the statistical analysis conducted on geographies consisting of 547,430,773 people shows a mild negative correlation between the proportion of Immigrants from Europe and labor force participation rate among population ages 16 and over in the United States with a correlation coefficient (R) of -0.385 and weighted average of 65.0%, a difference of 1.5%.
In Labor Force | Age > 16 Correlation Summary
| Measurement | Iranian | Immigrants from Europe |
| Minimum | 42.1% | 23.4% |
| Maximum | 73.0% | 100.0% |
| Range | 30.9% | 76.6% |
| Mean | 61.8% | 60.1% |
| Median | 64.8% | 64.3% |
| Interquartile 25% (IQ1) | 56.7% | 60.3% |
| Interquartile 75% (IQ3) | 66.7% | 65.8% |
| Interquartile Range (IQR) | 10.0% | 5.5% |
| Standard Deviation (Sample) | 7.1% | 13.6% |
| Standard Deviation (Population) | 7.0% | 13.5% |
Similar Demographics by In Labor Force | Age > 16
Demographics Similar to Iranians by In Labor Force | Age > 16
In terms of in labor force | age > 16, the demographic groups most similar to Iranians are Immigrants from Laos (66.0%, a difference of 0.010%), Chilean (66.0%, a difference of 0.010%), Aleut (66.0%, a difference of 0.020%), Immigrants from South America (66.0%, a difference of 0.030%), and Immigrants from Cambodia (66.0%, a difference of 0.040%).
| Demographics | Rating | Rank | In Labor Force | Age > 16 |
| Central Americans | 99.4 /100 | #84 | Exceptional 66.1% |
| Mongolians | 99.4 /100 | #85 | Exceptional 66.1% |
| South Americans | 99.4 /100 | #86 | Exceptional 66.0% |
| South American Indians | 99.4 /100 | #87 | Exceptional 66.0% |
| Bermudans | 99.3 /100 | #88 | Exceptional 66.0% |
| Immigrants | Laos | 99.2 /100 | #89 | Exceptional 66.0% |
| Chileans | 99.2 /100 | #90 | Exceptional 66.0% |
| Iranians | 99.2 /100 | #91 | Exceptional 66.0% |
| Aleuts | 99.1 /100 | #92 | Exceptional 66.0% |
| Immigrants | South America | 99.1 /100 | #93 | Exceptional 66.0% |
| Immigrants | Cambodia | 99.1 /100 | #94 | Exceptional 66.0% |
| Immigrants | Uruguay | 99.1 /100 | #95 | Exceptional 66.0% |
| Bangladeshis | 98.9 /100 | #96 | Exceptional 65.9% |
| Filipinos | 98.9 /100 | #97 | Exceptional 65.9% |
| Immigrants | Chile | 98.7 /100 | #98 | Exceptional 65.9% |
Demographics Similar to Immigrants from Europe by In Labor Force | Age > 16
In terms of in labor force | age > 16, the demographic groups most similar to Immigrants from Europe are Barbadian (65.0%, a difference of 0.0%), Scandinavian (65.0%, a difference of 0.0%), Immigrants from Fiji (65.0%, a difference of 0.0%), Immigrants from Portugal (65.0%, a difference of 0.010%), and Immigrants from Greece (65.0%, a difference of 0.010%).
| Demographics | Rating | Rank | In Labor Force | Age > 16 |
| Immigrants | Switzerland | 38.2 /100 | #186 | Fair 65.0% |
| Immigrants | Croatia | 35.7 /100 | #187 | Fair 65.0% |
| Immigrants | Portugal | 34.8 /100 | #188 | Fair 65.0% |
| Immigrants | Greece | 34.3 /100 | #189 | Fair 65.0% |
| Barbadians | 33.9 /100 | #190 | Fair 65.0% |
| Scandinavians | 33.7 /100 | #191 | Fair 65.0% |
| Immigrants | Fiji | 33.7 /100 | #192 | Fair 65.0% |
| Immigrants | Europe | 33.6 /100 | #193 | Fair 65.0% |
| Immigrants | Southern Europe | 31.3 /100 | #194 | Fair 65.0% |
| Romanians | 31.1 /100 | #195 | Fair 65.0% |
| Haitians | 30.6 /100 | #196 | Fair 65.0% |
| Immigrants | Italy | 28.7 /100 | #197 | Fair 65.0% |
| Greeks | 26.1 /100 | #198 | Fair 64.9% |
| Mexican American Indians | 23.1 /100 | #199 | Fair 64.9% |
| Armenians | 20.2 /100 | #200 | Fair 64.9% |