Immigrants from Venezuela vs Immigrants from Scotland In Labor Force | Age > 16
COMPARE
Immigrants from Venezuela
Immigrants from Scotland
In Labor Force | Age > 16
In Labor Force | Age > 16 Comparison
Immigrants from Venezuela
Immigrants from Scotland
66.4%
IN LABOR FORCE | AGE > 16
99.9/ 100
METRIC RATING
55th/ 347
METRIC RANK
64.2%
IN LABOR FORCE | AGE > 16
0.8/ 100
METRIC RATING
258th/ 347
METRIC RANK
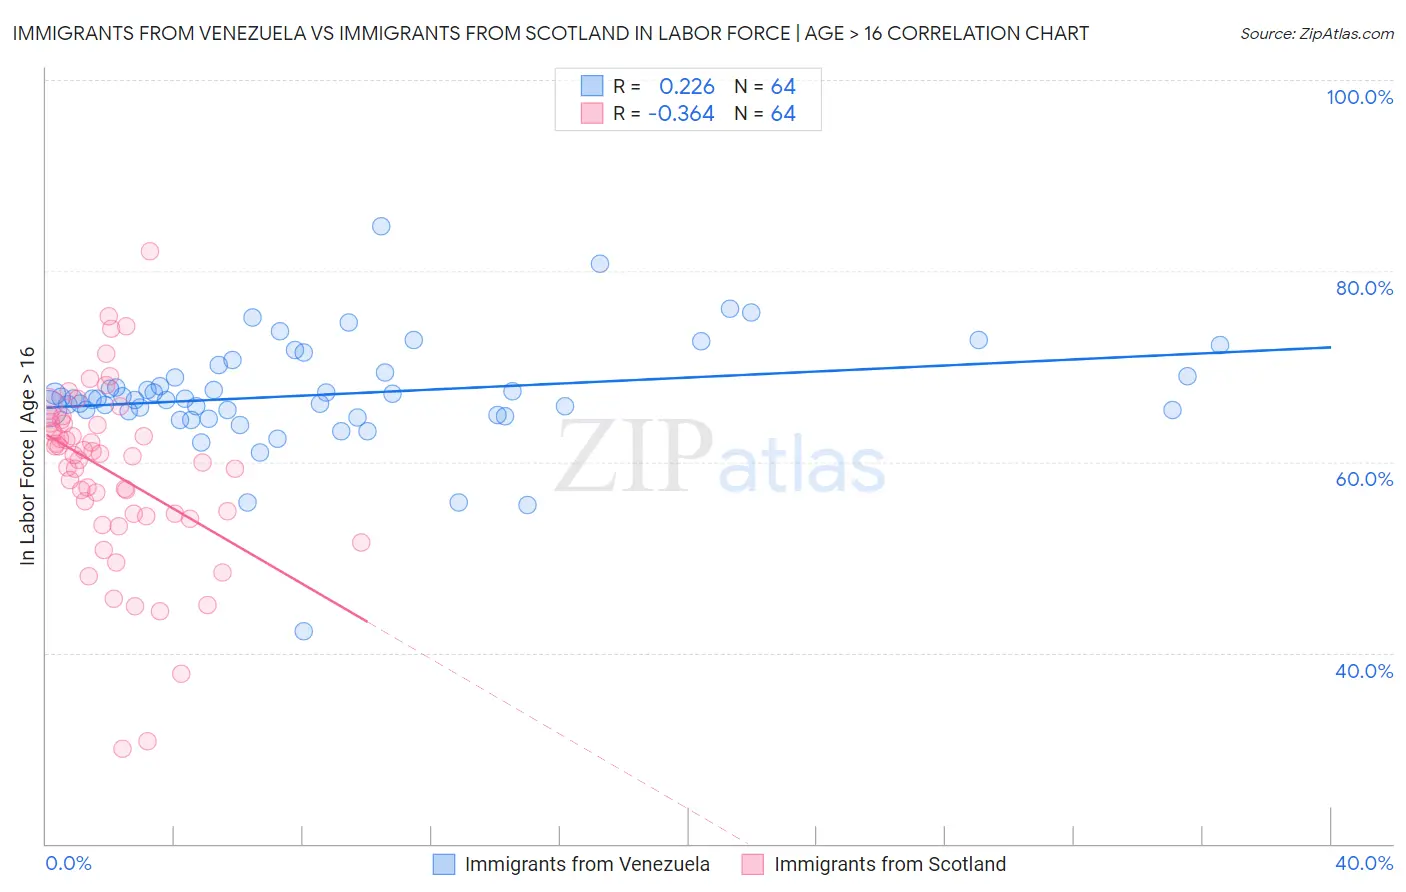
Immigrants from Venezuela vs Immigrants from Scotland In Labor Force | Age > 16 Correlation Chart
The statistical analysis conducted on geographies consisting of 287,871,143 people shows a weak positive correlation between the proportion of Immigrants from Venezuela and labor force participation rate among population ages 16 and over in the United States with a correlation coefficient (R) of 0.226 and weighted average of 66.4%. Similarly, the statistical analysis conducted on geographies consisting of 196,399,200 people shows a mild negative correlation between the proportion of Immigrants from Scotland and labor force participation rate among population ages 16 and over in the United States with a correlation coefficient (R) of -0.364 and weighted average of 64.2%, a difference of 3.4%.
In Labor Force | Age > 16 Correlation Summary
| Measurement | Immigrants from Venezuela | Immigrants from Scotland |
| Minimum | 42.3% | 30.0% |
| Maximum | 84.7% | 82.1% |
| Range | 42.4% | 52.1% |
| Mean | 67.1% | 58.8% |
| Median | 66.6% | 60.7% |
| Interquartile 25% (IQ1) | 65.1% | 54.4% |
| Interquartile 75% (IQ3) | 69.2% | 64.0% |
| Interquartile Range (IQR) | 4.1% | 9.6% |
| Standard Deviation (Sample) | 5.9% | 9.5% |
| Standard Deviation (Population) | 5.9% | 9.5% |
Similar Demographics by In Labor Force | Age > 16
Demographics Similar to Immigrants from Venezuela by In Labor Force | Age > 16
In terms of in labor force | age > 16, the demographic groups most similar to Immigrants from Venezuela are Immigrants from Senegal (66.4%, a difference of 0.030%), Bulgarian (66.4%, a difference of 0.040%), Immigrants from Bosnia and Herzegovina (66.5%, a difference of 0.050%), Immigrants from Sri Lanka (66.5%, a difference of 0.080%), and Paraguayan (66.5%, a difference of 0.10%).
| Demographics | Rating | Rank | In Labor Force | Age > 16 |
| Nigerians | 100.0 /100 | #48 | Exceptional 66.6% |
| Immigrants | Northern Africa | 100.0 /100 | #49 | Exceptional 66.6% |
| Cape Verdeans | 100.0 /100 | #50 | Exceptional 66.6% |
| Immigrants | Kuwait | 100.0 /100 | #51 | Exceptional 66.5% |
| Paraguayans | 99.9 /100 | #52 | Exceptional 66.5% |
| Immigrants | Sri Lanka | 99.9 /100 | #53 | Exceptional 66.5% |
| Immigrants | Bosnia and Herzegovina | 99.9 /100 | #54 | Exceptional 66.5% |
| Immigrants | Venezuela | 99.9 /100 | #55 | Exceptional 66.4% |
| Immigrants | Senegal | 99.9 /100 | #56 | Exceptional 66.4% |
| Bulgarians | 99.9 /100 | #57 | Exceptional 66.4% |
| Immigrants | Saudi Arabia | 99.9 /100 | #58 | Exceptional 66.3% |
| Immigrants | Turkey | 99.9 /100 | #59 | Exceptional 66.3% |
| Immigrants | Peru | 99.8 /100 | #60 | Exceptional 66.3% |
| Immigrants | Burma/Myanmar | 99.8 /100 | #61 | Exceptional 66.3% |
| Indonesians | 99.8 /100 | #62 | Exceptional 66.3% |
Demographics Similar to Immigrants from Scotland by In Labor Force | Age > 16
In terms of in labor force | age > 16, the demographic groups most similar to Immigrants from Scotland are Inupiat (64.3%, a difference of 0.020%), Immigrants from Western Europe (64.2%, a difference of 0.030%), Marshallese (64.2%, a difference of 0.040%), Basque (64.2%, a difference of 0.040%), and Finnish (64.2%, a difference of 0.050%).
| Demographics | Rating | Rank | In Labor Force | Age > 16 |
| Portuguese | 1.6 /100 | #251 | Tragic 64.4% |
| Immigrants | Dominican Republic | 1.5 /100 | #252 | Tragic 64.4% |
| Czechoslovakians | 1.4 /100 | #253 | Tragic 64.3% |
| Immigrants | Uzbekistan | 1.4 /100 | #254 | Tragic 64.3% |
| Hispanics or Latinos | 1.1 /100 | #255 | Tragic 64.3% |
| Immigrants | Mexico | 1.0 /100 | #256 | Tragic 64.3% |
| Inupiat | 0.8 /100 | #257 | Tragic 64.3% |
| Immigrants | Scotland | 0.8 /100 | #258 | Tragic 64.2% |
| Immigrants | Western Europe | 0.7 /100 | #259 | Tragic 64.2% |
| Marshallese | 0.7 /100 | #260 | Tragic 64.2% |
| Basques | 0.7 /100 | #261 | Tragic 64.2% |
| Finns | 0.7 /100 | #262 | Tragic 64.2% |
| Bahamians | 0.6 /100 | #263 | Tragic 64.2% |
| Dutch | 0.6 /100 | #264 | Tragic 64.2% |
| Cubans | 0.5 /100 | #265 | Tragic 64.2% |