Iranian vs Immigrants from Austria In Labor Force | Age > 16
COMPARE
Iranian
Immigrants from Austria
In Labor Force | Age > 16
In Labor Force | Age > 16 Comparison
Iranians
Immigrants from Austria
66.0%
IN LABOR FORCE | AGE > 16
99.2/ 100
METRIC RATING
91st/ 347
METRIC RANK
63.9%
IN LABOR FORCE | AGE > 16
0.1/ 100
METRIC RATING
286th/ 347
METRIC RANK
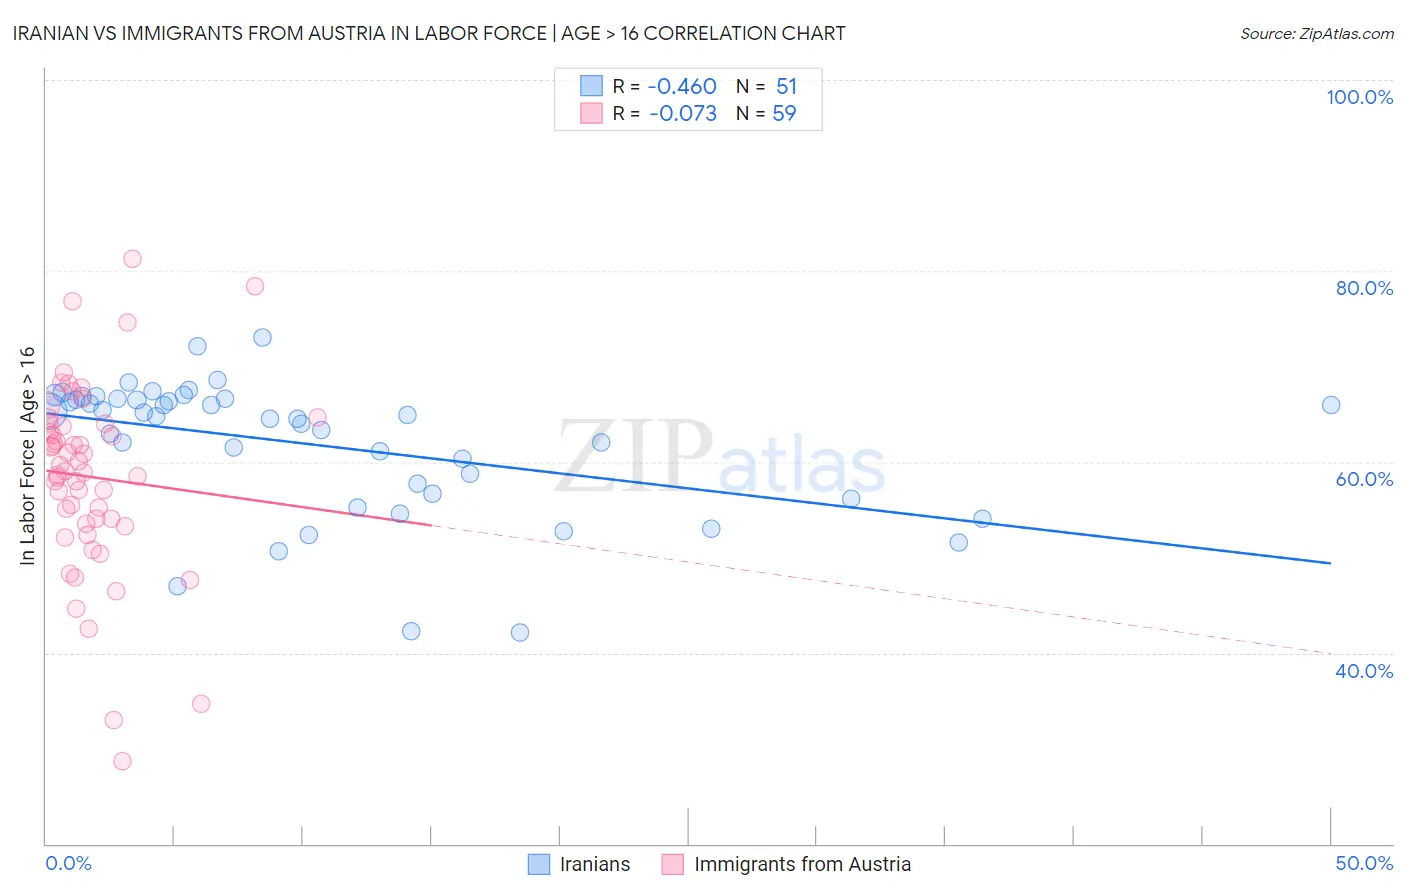
Iranian vs Immigrants from Austria In Labor Force | Age > 16 Correlation Chart
The statistical analysis conducted on geographies consisting of 316,907,854 people shows a moderate negative correlation between the proportion of Iranians and labor force participation rate among population ages 16 and over in the United States with a correlation coefficient (R) of -0.460 and weighted average of 66.0%. Similarly, the statistical analysis conducted on geographies consisting of 167,973,659 people shows a slight negative correlation between the proportion of Immigrants from Austria and labor force participation rate among population ages 16 and over in the United States with a correlation coefficient (R) of -0.073 and weighted average of 63.9%, a difference of 3.3%.
In Labor Force | Age > 16 Correlation Summary
| Measurement | Iranian | Immigrants from Austria |
| Minimum | 42.1% | 28.7% |
| Maximum | 73.0% | 81.3% |
| Range | 30.9% | 52.6% |
| Mean | 61.8% | 58.4% |
| Median | 64.8% | 59.0% |
| Interquartile 25% (IQ1) | 56.7% | 53.5% |
| Interquartile 75% (IQ3) | 66.7% | 64.0% |
| Interquartile Range (IQR) | 10.0% | 10.5% |
| Standard Deviation (Sample) | 7.1% | 10.0% |
| Standard Deviation (Population) | 7.0% | 9.9% |
Similar Demographics by In Labor Force | Age > 16
Demographics Similar to Iranians by In Labor Force | Age > 16
In terms of in labor force | age > 16, the demographic groups most similar to Iranians are Immigrants from Laos (66.0%, a difference of 0.010%), Chilean (66.0%, a difference of 0.010%), Aleut (66.0%, a difference of 0.020%), Immigrants from South America (66.0%, a difference of 0.030%), and Immigrants from Cambodia (66.0%, a difference of 0.040%).
| Demographics | Rating | Rank | In Labor Force | Age > 16 |
| Central Americans | 99.4 /100 | #84 | Exceptional 66.1% |
| Mongolians | 99.4 /100 | #85 | Exceptional 66.1% |
| South Americans | 99.4 /100 | #86 | Exceptional 66.0% |
| South American Indians | 99.4 /100 | #87 | Exceptional 66.0% |
| Bermudans | 99.3 /100 | #88 | Exceptional 66.0% |
| Immigrants | Laos | 99.2 /100 | #89 | Exceptional 66.0% |
| Chileans | 99.2 /100 | #90 | Exceptional 66.0% |
| Iranians | 99.2 /100 | #91 | Exceptional 66.0% |
| Aleuts | 99.1 /100 | #92 | Exceptional 66.0% |
| Immigrants | South America | 99.1 /100 | #93 | Exceptional 66.0% |
| Immigrants | Cambodia | 99.1 /100 | #94 | Exceptional 66.0% |
| Immigrants | Uruguay | 99.1 /100 | #95 | Exceptional 66.0% |
| Bangladeshis | 98.9 /100 | #96 | Exceptional 65.9% |
| Filipinos | 98.9 /100 | #97 | Exceptional 65.9% |
| Immigrants | Chile | 98.7 /100 | #98 | Exceptional 65.9% |
Demographics Similar to Immigrants from Austria by In Labor Force | Age > 16
In terms of in labor force | age > 16, the demographic groups most similar to Immigrants from Austria are Scottish (63.9%, a difference of 0.0%), Slovak (63.9%, a difference of 0.030%), Spanish (63.9%, a difference of 0.050%), French (63.9%, a difference of 0.060%), and Immigrants from Germany (63.9%, a difference of 0.070%).
| Demographics | Rating | Rank | In Labor Force | Age > 16 |
| Welsh | 0.2 /100 | #279 | Tragic 64.0% |
| Immigrants | St. Vincent and the Grenadines | 0.2 /100 | #280 | Tragic 64.0% |
| French Canadians | 0.2 /100 | #281 | Tragic 64.0% |
| Immigrants | Guyana | 0.2 /100 | #282 | Tragic 64.0% |
| Immigrants | Germany | 0.1 /100 | #283 | Tragic 63.9% |
| French | 0.1 /100 | #284 | Tragic 63.9% |
| Slovaks | 0.1 /100 | #285 | Tragic 63.9% |
| Immigrants | Austria | 0.1 /100 | #286 | Tragic 63.9% |
| Scottish | 0.1 /100 | #287 | Tragic 63.9% |
| Spanish | 0.1 /100 | #288 | Tragic 63.9% |
| Celtics | 0.1 /100 | #289 | Tragic 63.8% |
| Hungarians | 0.1 /100 | #290 | Tragic 63.8% |
| Nepalese | 0.1 /100 | #291 | Tragic 63.8% |
| Spanish American Indians | 0.1 /100 | #292 | Tragic 63.8% |
| English | 0.1 /100 | #293 | Tragic 63.7% |