Immigrants from Micronesia vs Tsimshian In Labor Force | Age 35-44
COMPARE
Immigrants from Micronesia
Tsimshian
In Labor Force | Age 35-44
In Labor Force | Age 35-44 Comparison
Immigrants from Micronesia
Tsimshian
83.1%
IN LABOR FORCE | AGE 35-44
0.0/ 100
METRIC RATING
279th/ 347
METRIC RANK
83.5%
IN LABOR FORCE | AGE 35-44
0.2/ 100
METRIC RATING
258th/ 347
METRIC RANK
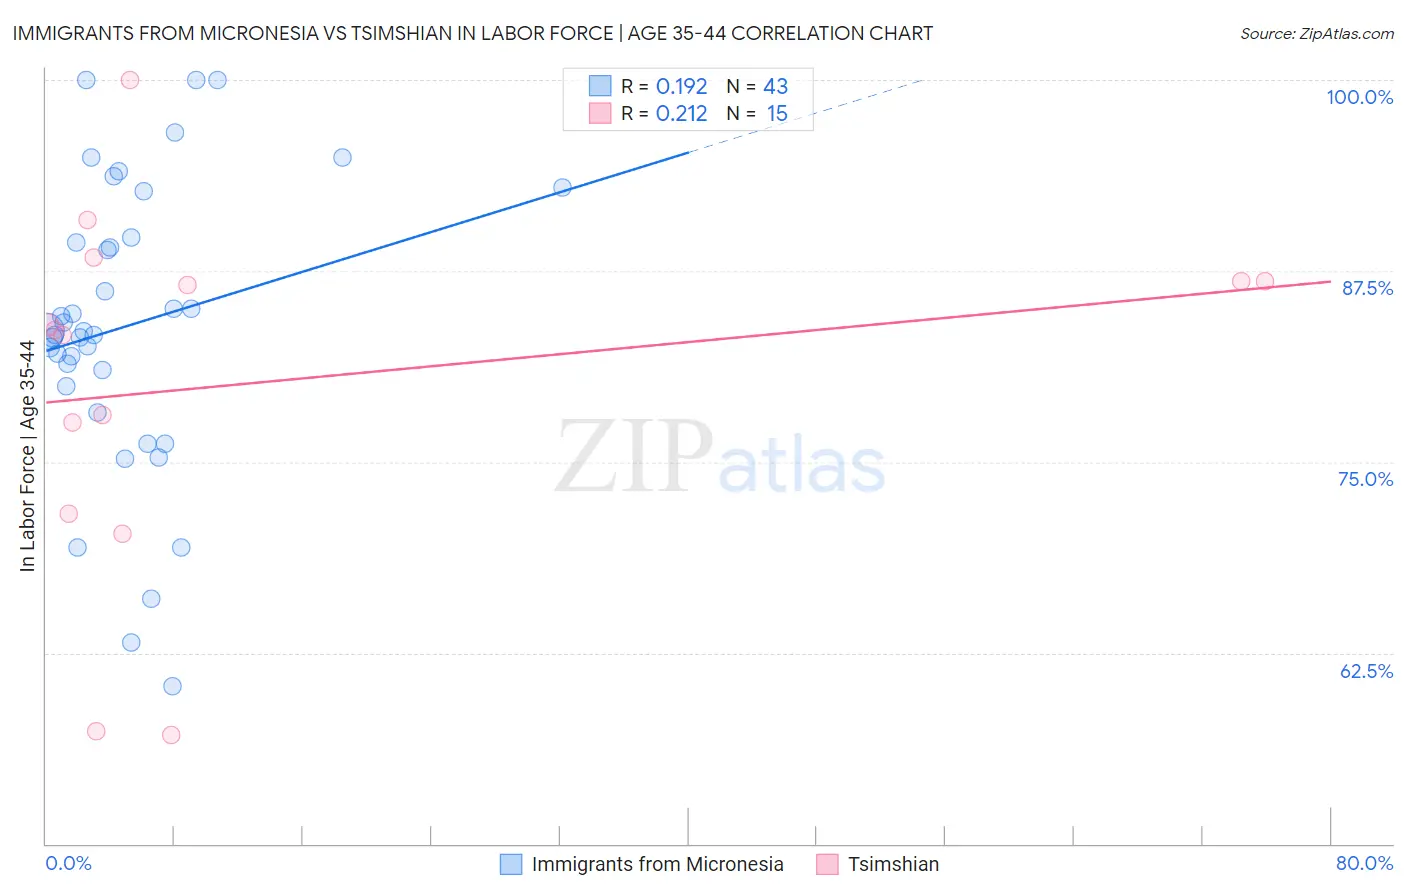
Immigrants from Micronesia vs Tsimshian In Labor Force | Age 35-44 Correlation Chart
The statistical analysis conducted on geographies consisting of 61,600,178 people shows a poor positive correlation between the proportion of Immigrants from Micronesia and labor force participation rate among population between the ages 35 and 44 in the United States with a correlation coefficient (R) of 0.192 and weighted average of 83.1%. Similarly, the statistical analysis conducted on geographies consisting of 15,626,462 people shows a weak positive correlation between the proportion of Tsimshian and labor force participation rate among population between the ages 35 and 44 in the United States with a correlation coefficient (R) of 0.212 and weighted average of 83.5%, a difference of 0.51%.
In Labor Force | Age 35-44 Correlation Summary
| Measurement | Immigrants from Micronesia | Tsimshian |
| Minimum | 60.3% | 57.1% |
| Maximum | 100.0% | 100.0% |
| Range | 39.7% | 42.9% |
| Mean | 83.9% | 80.2% |
| Median | 83.6% | 83.6% |
| Interquartile 25% (IQ1) | 79.9% | 71.6% |
| Interquartile 75% (IQ3) | 89.7% | 86.8% |
| Interquartile Range (IQR) | 9.8% | 15.2% |
| Standard Deviation (Sample) | 9.4% | 11.9% |
| Standard Deviation (Population) | 9.3% | 11.5% |
Similar Demographics by In Labor Force | Age 35-44
Demographics Similar to Immigrants from Micronesia by In Labor Force | Age 35-44
In terms of in labor force | age 35-44, the demographic groups most similar to Immigrants from Micronesia are Belizean (83.1%, a difference of 0.010%), Dominican (83.1%, a difference of 0.040%), Samoan (83.2%, a difference of 0.080%), Delaware (83.2%, a difference of 0.090%), and Hawaiian (83.2%, a difference of 0.10%).
| Demographics | Rating | Rank | In Labor Force | Age 35-44 |
| Immigrants | Fiji | 0.0 /100 | #272 | Tragic 83.2% |
| Spanish | 0.0 /100 | #273 | Tragic 83.2% |
| Immigrants | Nonimmigrants | 0.0 /100 | #274 | Tragic 83.2% |
| Hawaiians | 0.0 /100 | #275 | Tragic 83.2% |
| Delaware | 0.0 /100 | #276 | Tragic 83.2% |
| Samoans | 0.0 /100 | #277 | Tragic 83.2% |
| Belizeans | 0.0 /100 | #278 | Tragic 83.1% |
| Immigrants | Micronesia | 0.0 /100 | #279 | Tragic 83.1% |
| Dominicans | 0.0 /100 | #280 | Tragic 83.1% |
| Guatemalans | 0.0 /100 | #281 | Tragic 83.0% |
| Osage | 0.0 /100 | #282 | Tragic 82.9% |
| Immigrants | Guatemala | 0.0 /100 | #283 | Tragic 82.9% |
| Immigrants | Dominican Republic | 0.0 /100 | #284 | Tragic 82.9% |
| Fijians | 0.0 /100 | #285 | Tragic 82.9% |
| Immigrants | Bangladesh | 0.0 /100 | #286 | Tragic 82.9% |
Demographics Similar to Tsimshian by In Labor Force | Age 35-44
In terms of in labor force | age 35-44, the demographic groups most similar to Tsimshian are Basque (83.6%, a difference of 0.020%), Immigrants from El Salvador (83.5%, a difference of 0.020%), Vietnamese (83.5%, a difference of 0.030%), Japanese (83.6%, a difference of 0.040%), and Immigrants from Dominica (83.5%, a difference of 0.040%).
| Demographics | Rating | Rank | In Labor Force | Age 35-44 |
| Salvadorans | 0.4 /100 | #251 | Tragic 83.6% |
| Immigrants | Guyana | 0.4 /100 | #252 | Tragic 83.6% |
| Lebanese | 0.4 /100 | #253 | Tragic 83.6% |
| Tongans | 0.4 /100 | #254 | Tragic 83.6% |
| Immigrants | Azores | 0.3 /100 | #255 | Tragic 83.6% |
| Japanese | 0.3 /100 | #256 | Tragic 83.6% |
| Basques | 0.3 /100 | #257 | Tragic 83.6% |
| Tsimshian | 0.2 /100 | #258 | Tragic 83.5% |
| Immigrants | El Salvador | 0.2 /100 | #259 | Tragic 83.5% |
| Vietnamese | 0.2 /100 | #260 | Tragic 83.5% |
| Immigrants | Dominica | 0.2 /100 | #261 | Tragic 83.5% |
| Immigrants | Congo | 0.2 /100 | #262 | Tragic 83.5% |
| Iroquois | 0.2 /100 | #263 | Tragic 83.5% |
| Scotch-Irish | 0.1 /100 | #264 | Tragic 83.5% |
| Central Americans | 0.1 /100 | #265 | Tragic 83.5% |