Inupiat vs Tsimshian Single Mother Households
COMPARE
Inupiat
Tsimshian
Single Mother Households
Single Mother Households Comparison
Inupiat
Tsimshian
8.5%
SINGLE MOTHER HOUSEHOLDS
0.0/ 100
METRIC RATING
330th/ 347
METRIC RANK
6.0%
SINGLE MOTHER HOUSEHOLDS
85.2/ 100
METRIC RATING
141st/ 347
METRIC RANK
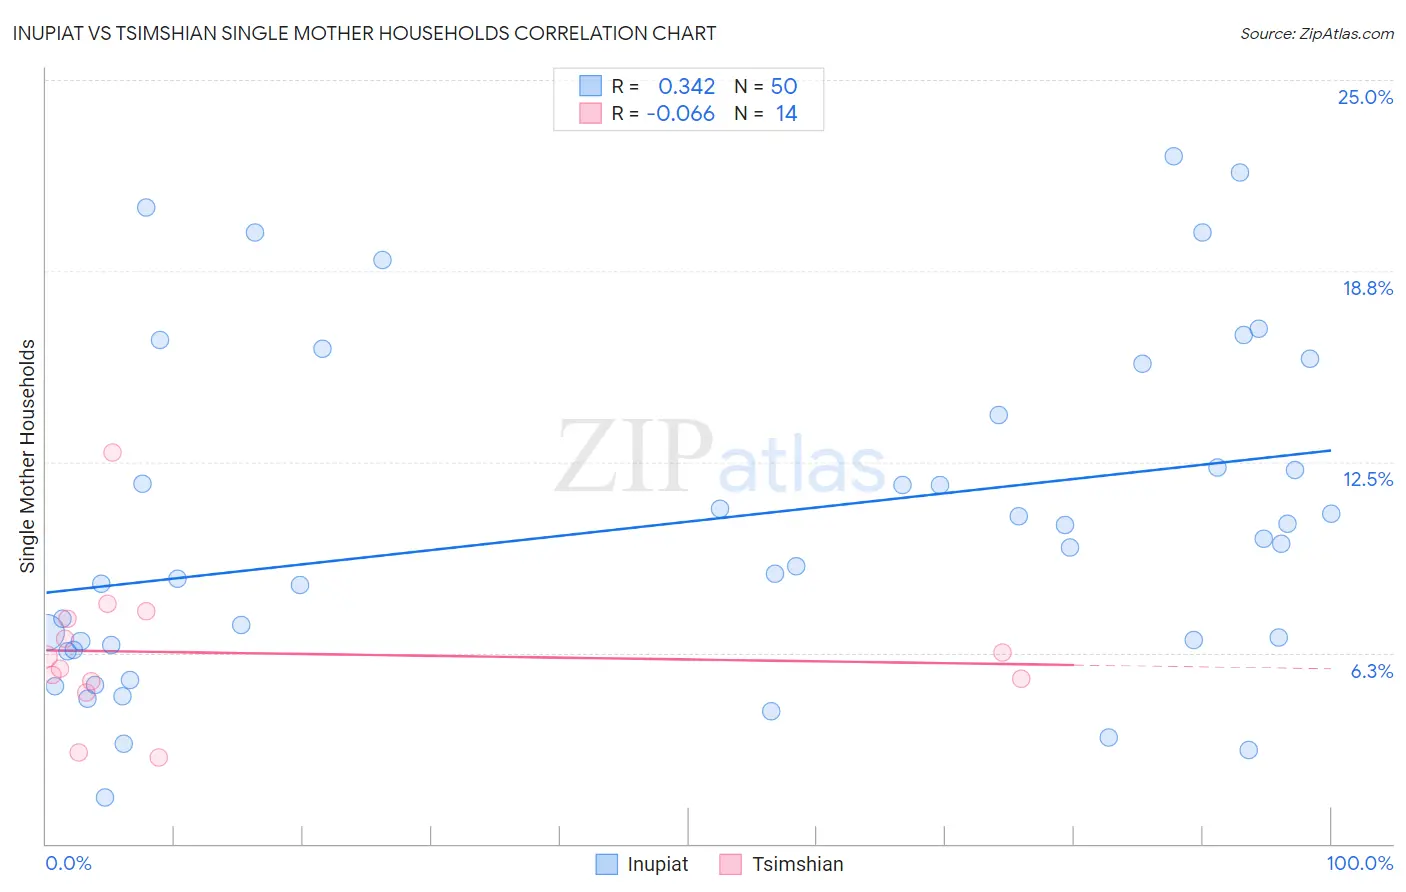
Inupiat vs Tsimshian Single Mother Households Correlation Chart
The statistical analysis conducted on geographies consisting of 96,271,599 people shows a mild positive correlation between the proportion of Inupiat and percentage of single mother households in the United States with a correlation coefficient (R) of 0.342 and weighted average of 8.5%. Similarly, the statistical analysis conducted on geographies consisting of 15,617,285 people shows a slight negative correlation between the proportion of Tsimshian and percentage of single mother households in the United States with a correlation coefficient (R) of -0.066 and weighted average of 6.0%, a difference of 41.2%.
Single Mother Households Correlation Summary
| Measurement | Inupiat | Tsimshian |
| Minimum | 1.5% | 2.8% |
| Maximum | 22.5% | 12.8% |
| Range | 21.0% | 10.0% |
| Mean | 10.5% | 6.3% |
| Median | 9.7% | 5.9% |
| Interquartile 25% (IQ1) | 6.5% | 5.3% |
| Interquartile 75% (IQ3) | 14.0% | 7.4% |
| Interquartile Range (IQR) | 7.5% | 2.1% |
| Standard Deviation (Sample) | 5.4% | 2.4% |
| Standard Deviation (Population) | 5.4% | 2.3% |
Similar Demographics by Single Mother Households
Demographics Similar to Inupiat by Single Mother Households
In terms of single mother households, the demographic groups most similar to Inupiat are Sioux (8.5%, a difference of 0.0%), Hopi (8.5%, a difference of 0.11%), Yakama (8.4%, a difference of 0.85%), Immigrants from Haiti (8.4%, a difference of 1.0%), and British West Indian (8.4%, a difference of 1.2%).
| Demographics | Rating | Rank | Single Mother Households |
| Haitians | 0.0 /100 | #323 | Tragic 8.3% |
| Immigrants | Jamaica | 0.0 /100 | #324 | Tragic 8.4% |
| Immigrants | Caribbean | 0.0 /100 | #325 | Tragic 8.4% |
| British West Indians | 0.0 /100 | #326 | Tragic 8.4% |
| Immigrants | Haiti | 0.0 /100 | #327 | Tragic 8.4% |
| Yakama | 0.0 /100 | #328 | Tragic 8.4% |
| Hopi | 0.0 /100 | #329 | Tragic 8.5% |
| Inupiat | 0.0 /100 | #330 | Tragic 8.5% |
| Sioux | 0.0 /100 | #331 | Tragic 8.5% |
| U.S. Virgin Islanders | 0.0 /100 | #332 | Tragic 8.6% |
| Liberians | 0.0 /100 | #333 | Tragic 8.6% |
| Immigrants | Liberia | 0.0 /100 | #334 | Tragic 8.7% |
| Immigrants | Dominica | 0.0 /100 | #335 | Tragic 8.7% |
| Puerto Ricans | 0.0 /100 | #336 | Tragic 8.7% |
| Navajo | 0.0 /100 | #337 | Tragic 8.8% |
Demographics Similar to Tsimshian by Single Mother Households
In terms of single mother households, the demographic groups most similar to Tsimshian are Immigrants from Egypt (6.0%, a difference of 0.050%), Immigrants from Iraq (6.0%, a difference of 0.090%), French (6.0%, a difference of 0.10%), Syrian (6.0%, a difference of 0.17%), and Korean (6.0%, a difference of 0.19%).
| Demographics | Rating | Rank | Single Mother Households |
| Canadians | 90.5 /100 | #134 | Exceptional 5.9% |
| Immigrants | Saudi Arabia | 90.2 /100 | #135 | Exceptional 5.9% |
| Jordanians | 88.9 /100 | #136 | Excellent 6.0% |
| Immigrants | Pakistan | 88.4 /100 | #137 | Excellent 6.0% |
| Icelanders | 86.9 /100 | #138 | Excellent 6.0% |
| Syrians | 86.0 /100 | #139 | Excellent 6.0% |
| French | 85.7 /100 | #140 | Excellent 6.0% |
| Tsimshian | 85.2 /100 | #141 | Excellent 6.0% |
| Immigrants | Egypt | 85.0 /100 | #142 | Excellent 6.0% |
| Immigrants | Iraq | 84.8 /100 | #143 | Excellent 6.0% |
| Koreans | 84.4 /100 | #144 | Excellent 6.0% |
| Arabs | 84.0 /100 | #145 | Excellent 6.0% |
| French Canadians | 82.6 /100 | #146 | Excellent 6.0% |
| Immigrants | Jordan | 82.3 /100 | #147 | Excellent 6.0% |
| Scotch-Irish | 82.0 /100 | #148 | Excellent 6.0% |